
The number of phone calls (in thousands) are made by a telephone company for five weeks as given below :
| Week | 1 | 2 | 3 | 4 | 5 |
| No. of telephone calls | 110 | 130 | 93 | 104 | 211 |
Taking a period of moving averages as 3 weeks, the graph of moving averages can be depicted directly as :
Answer & explanation
Correct answer: option 4
The correct answer is Option (4) →
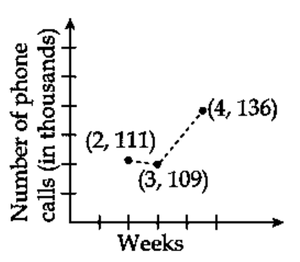
A 3-week moving average is the mean of three consecutive weeks, placed against the middle week. With 5 weeks there are three such averages, for weeks 2, 3 and 4.
\( \displaystyle \text{Week 2: } \frac{110 + 130 + 93}{3} = \frac{333}{3} = 111 \)
\( \displaystyle \text{Week 3: } \frac{130 + 93 + 104}{3} = \frac{327}{3} = 109 \)
\( \displaystyle \text{Week 4: } \frac{93 + 104 + 211}{3} = \frac{408}{3} = 136 \)
So the graph joins the points (2, 111), (3, 109) and (4, 136).
Why the other options are incorrect
Option (1) the graph through (2, 112), (3, 110) and (4, 130) — Incorrect. All three plotted values are wrong; they should be 111, 109 and 136.
Option (2) the graph through (2, 111), (3, 109) and (4, 130) — Incorrect. The week 4 average is 136, not 130.
Option (3) the graph through (1, 110), (2, 111), (3, 110) and (4, 136) — Incorrect. There is no 3-week moving average for week 1, and the week 3 average is 109, not 110.