CUET Preparation Today
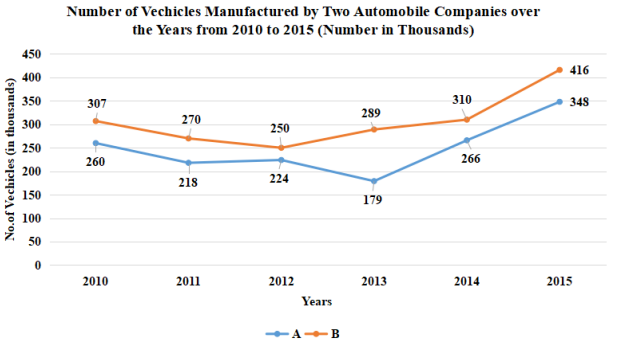
Study the line graph and answer the question that follows. The line graph represents the number of vehicles (in thousands) manufactured by two automobile companies A and B over the years from 2010 to 2015. The X-axis represents the years and the Y-axis represents number of vehicles in thousands. (The data shown here is only for mathematical exercise. They do not represent the actual figures of the country.)
What is the difference between the average number of vehicles (in thousands) of the companies A and B for the years 2010. 2012. 2014 and 2015? |
48.25 45.75 50.25 46.25 |
46.25 |
Average number of vehicles manufactured by A in 2010, 2012, 2014 and 2015 = \(\frac{260+224+266+348 }{4}\) = \(\frac{ 1098 }{4}\) = 274.5 Average number of vehicles manufactured by B in 2010, 2012, 2014 and 2015 = \(\frac{307+250+310+416 }{4}\) = \(\frac{ 1283 }{4}\) = 320.75 Required difference = 320.75 - 274.5 = 46.25
|