CUET Preparation Today
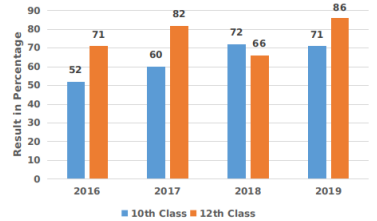
The given bar graph represents the pass percentage of the 10th and 12th classes of a school during the consecutive four year period 2016-2019.
What is the average of pass percentage of the 10th class for all four years? |
65.75% 63.25% 63.75% 65.25% |
63.75% |
Total pass students in 10th class = 52 + 60 + 72 + 71 = 255 Average pass students in 10th class = \(\frac{255 }{4}\) = 63.75%
|