CUET Preparation Today
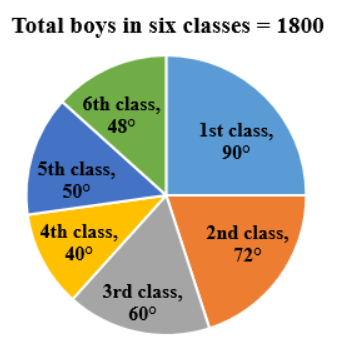
The pie-chart below shows, in terms of the central angles of the sectors representing each group, the distribution of number of boys in six classes of a school in a village.
If 40% of the students studying in 3rd class like to play hockey, then the number of students studying in 3rd class who do NOT like to play hockey is: |
180 144 216 120 |
180 |
60% = \(\frac{3}{5}\) Number of students who do not like hockey = \(\frac{3}{5}\) × \(\frac{60}{360}\) × 1800 = \(\frac{3}{5}\) × 300 = 180 |