CUET Preparation Today
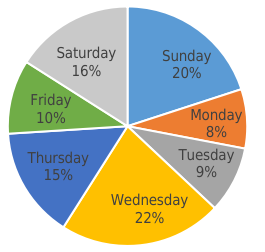
Study the given chart and answer the question that follows. The Pie chart represents the percentage-wise distribution of the total number of Vanilla cakes and Chocolates cakes sold everyday in a week. the total number of cakes sold in a week = 10500.
The ratio of the number of Vanilla cakes sold to the number of Chocolates cakes sold on Saturday is 4 : 3, the selling price of one Vanilla cake is ₹8 and that of one Chocolate cake is ₹15, then the total amount earned (in ₹) by selling all Vanilla cakes and Chocolates cakes on Saturday is :
|
14,880 10,488 20,000 18,480 |
18,480 |
16% = \(\frac{4}{25}\) Total cake sold on saturday = \(\frac{4}{25}\) × 10500110 = 1680 ratio of vanilla cakes sold to chocolate cakes sold on Friday = 4 : 3 7R = 1680 1R = 240 Number of vanilla cake = 4R = 960 , Number of chocolate cake = 3R = 720 Total earned amount = 960 × 8 + 720 × 15 = 7680 + 10800 = 18480 |