CUET Preparation Today
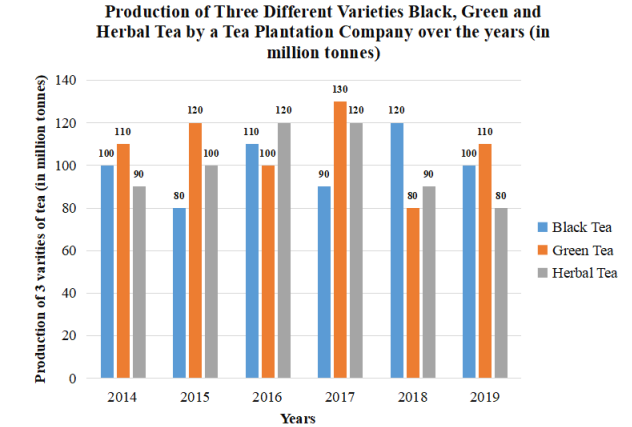
Study the given bar graph and answer the question that follows. A tea plantation company produces three varieties of tea—black tea, green tea and herbal tea. The production of three varieties (in million tonnes) over a period of six years from 2014 to 2019, has been shown in the bar graph here. The X-axis represents the years and the Y-axis displays the production of the three varieties in million tonnes.
The average value of the combined production of black tea and herbal tea from 2014 to 2019 is what percent (up to 1 decimal place) of the average value of the production of green tea during the same period? |
92.4 91.4 91.3 92.3 |
92.3 |
Average value of the combined production of black tea and herbal tea from 2014 to 2019 = \(\frac{(100+80+110+90+120+100) + ( 90+100+120+120+90+80) }{10}\) = (\frac{ 1200}{10}\) = 120 Average value of production of green tea from 2014 to 2019 = (\frac{ 110+120+100+130+80+110 }{5}\) = (\frac{ 650 }{5}\) = 130 Required percentage = \(\frac{120 }{130}\) × 100 = 92.3% |