
The graph slowing the distribution of kinetic energy of electrons emitted during beta decay would be:
Answer & explanation
Correct answer: option 3
The correct answer is Option (3)
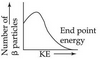
In beta decay the nucleus emits an electron together with an antineutrino, and the energy released is shared between the two in every possible proportion. The electrons therefore do not all have one energy; they show a continuous distribution of kinetic energy.
The graph of the number of β particles against kinetic energy is a smooth curve with a single broad maximum. It falls to zero at the end point energy, the largest energy an electron can have (when the antineutrino carries away almost nothing).