
CUETMOCK
  • Pricing
  • Mentors
Log inStart freeStart free mocks→

First test, then trust

Try a free CUET mock test.

Join 5,00,000+ students who rehearsed exam day on the exact NTA screen before sitting CUET. On the web and on Android.

Start free mocks →Get the Android app
CUETMOCK

India's #1 CUET Mock Test Platform. Original NCERT-based questions on the exact NTA exam screen — trusted by 5,00,000+ students since CUET 2022.

Get it onGoogle PlayScan to download the CUETMOCK app

Mock tests

  • CUET mock test series
  • Browse all papers
  • Commerce mocks
  • Humanities (Arts) mocks
  • Science mocks
  • Languages & GAT mocks
  • Free practice questions
  • Pricing

Resources

  • CUET exam guide
  • CUET syllabus
  • Universities accepting CUET
  • Expert blogs
  • News & notifications
  • Webinars & counselling
  • CUET score calculator
  • How we estimate your rank
  • FAQs

Company

  • About us
  • Our leadership & team
  • Our toppers
  • Mentors
  • For schools
  • Contact us
  • Terms
  • Privacy
  • Refund policy

Talk to us

+91 7696 6630 56info@cuetmock.comWhatsApp us

Our other platforms

  • JEE Mock — For IIT-JEE aspirants
  • NEET Mock — For NEET aspirants

Newsletter

Exam updates, study material and offers — no spam.

© 2026 NYC Ventures Pvt. Ltd.

701-702, Royal Business Park, Zirakpur, Punjab - 140603

  • Terms of use
  • Privacy policy
  • Refund policy
  • Contact us

iCUETMOCK is an independent preparation platform, not affiliated with the National Testing Agency (NTA). Always check exam details on the official NTA website.

  • Home
  • Mock tests
  • CUET guide
  • Pricing
  • Log in
Home/Practice questions/General Aptitude Test
General Aptitude TestQuantitative ReasoningData Interpretation & Stats

The table below shows the number of employees of companies A, B and C…

The table below shows the number of employees of companies A, B and C for given 4 years.  Study the table and answer the following questions.
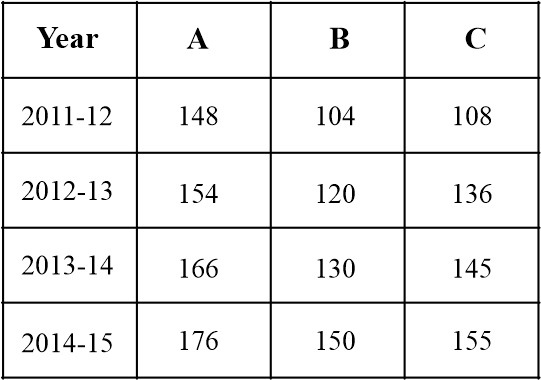
What is the percentage increase in number of employees of company C from 2011 - 2012 to 2014 - 2015 (approx.)?

Answer & explanation+

Correct answer: option 1

Difference between no. of employees of company C from 2011 - 2012 to 2014 - 2015 = 155 - 108 = 47

Percentage increase in no. of employees of company C from 2011 - 2012 to 2014 - 2015 = \(\frac{47}{108}\) × 100 = 43.518% or 43.52% (approx.)

Advertisement

Practise more on Quantitative Reasoning

Chapter-wise mocks on the real NTA exam screen, with solutions and your rank. Your first mocks are free.

Start free mocks →

Advertisement

Next questions

  1. When the price of an item was reduced by 20%, its sales increased by x% . If there is an increase of 25% in the receipt of the revenue, the…General Aptitude Test · Numerical Ability
  2. Fill in the blank with the most appropriate word. The doctor often made his patients ______ for long.English · Fill Blanks
  3. Change the following sentence into Indirect Speech : I said to my brother, "Don't tell a lie."English · Direct/indirect
  4. Which among the following would be nucleoside found only in RNA ?Biology · Molecular Basis of Inheritance
  5. If sin^2 x = 3 cos^2 x and 0° ≤ x ≤ 90°, then what is the value of x/2 ?General Aptitude Test · Quantitative Reasoning
  6. In the following question, if a mirror is placed on the line AB, then which of the answer figures is the right image of the given figure?General Aptitude Test · Non-Verbal Reasoning
  7. Which of the following factors affect the financing decision? (A) Cash Flow Position of the Company(B) Stability of Earnings(C) State of Ca…Business Studies · Financial Management
  8. Aphids and mosquitoes can be controlled by, respectively:Biology · Microbes in Human Welfare
  9. Select the most appropriate meaning of the given idiom. To make matters worseEnglish · Grammar: Idioms
  10. The feasible region for an LPP is given by the following graph The maximum value of the objective function Z=4x+10y is:Applied Maths. Section B2 · Linear Programming