CUET Preparation Today
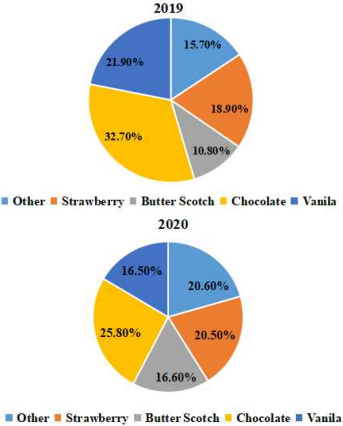
Study the given pie-charts and answer the question that follows. The pie charts represent the popularity of ice-cream flavours among families in the years 2019 and 2020.
If l% increase resulted in annual additional sales of ₹ 10,000, then how much (in ₹), did the combined Strawberry, other and Butterscotch sales increase from 2019 to 2020? |
1,23,000 1,32,000 3,12,000 2,13,000 |
1,23,000 |
Combined Strawberry, other and Butterscotch sales in 2019 = 15.70% + 18.90% + 10.80% = 45.4% combined Strawberry, other and Butterscotch sales in 2020 = 20.60% + 20.50% + 16.60% = 57.7% Combined increase in sale of Strawberry, other and Butterscotch sales from 2019 to 2020 = 57.7% - 45.4% = 12.3% ATQ , 1% increase in sale = Additional sale of Rs.10000 So , with increase in 12.3% sale , Additional sale is = 12.3 × 10000 = 123000 |