CUET Preparation Today
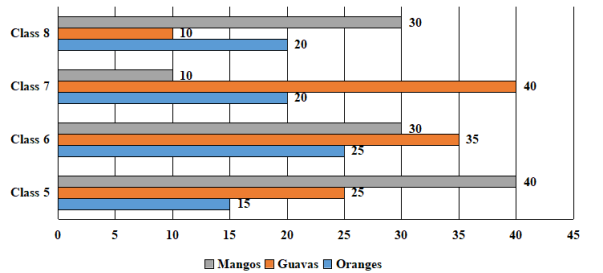
The following bar graph shows the data of the number of students of different classes who like to eat different types of fruits.
What percentage of the students of class 8 mentioned here like guavas? |
36% 50% $16\frac{2}{3}$% 60% |
$16\frac{2}{3}$% |
Total number of students in class 8 = 30 + 10 + 20 = 60 Number of students of class 8 liked Guavas = 10 Percentage of students likes Guavas = \(\frac{10}{60}\) × 100 = 16\(\frac{2}{3}\)% |