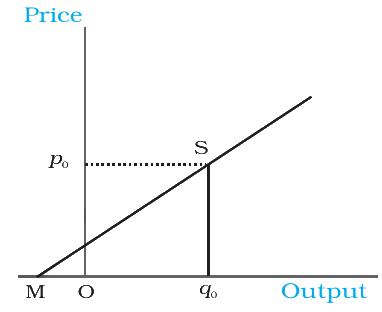
What is the price elasticity of the supply in the given figure?
Answer & explanation
Correct answer: option 4
The correct answer is Option (4) → >1
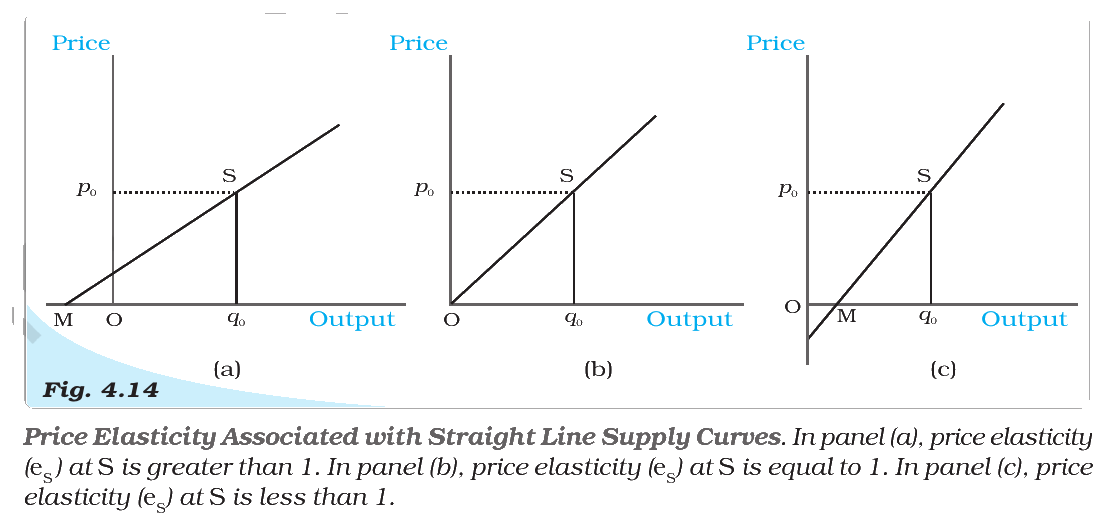
The supply curve in the figure is a straight line that cuts the price axis. Extended, it meets the quantity axis at M, left of O. So Mq0 is longer than Oq0, and eS = Mq0/Oq0 > 1.
NCERT (2026-27): “The Geometric Method Consider the Figure 4.14. Panel (a) shows a straight line supply curve. S is a point on the supply curve. It cuts the price-axis at its positive range and as we extend the straight line, it cuts the quantity-axis at M which is at its negative range. The price elasticity of this supply curve at the point S is given by the ratio, Mq0/Oq0. For any point S on such a supply curve, we see that Mq0 > Oq0. The elasticity at any point on such a supply curve, therefore, will be greater than 1.”
|