CUET Preparation Today
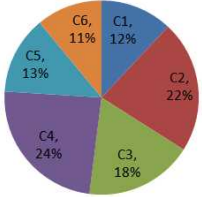
The Pie Chart given below presents the number of laptops as a percentage of the total number of laptops in an office delivered by six different companies. The central angles shown in the Pie Chart are not as per any chosen scale.
What is the ratio of the number of laptops of Company C1 to that of Company C3? |
2 : 1 12 : 11 2 : 3 6 : 11 |
2 : 3 |
Laptop of company C1 : Laptop of company C3 12 : 18 2 : 3 |