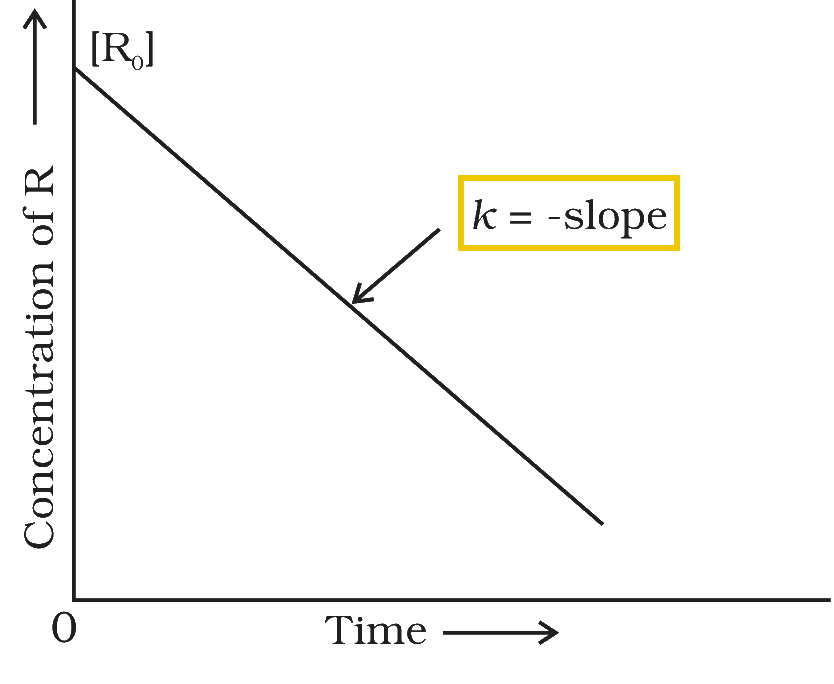
From graph, predict the order of the reaction:
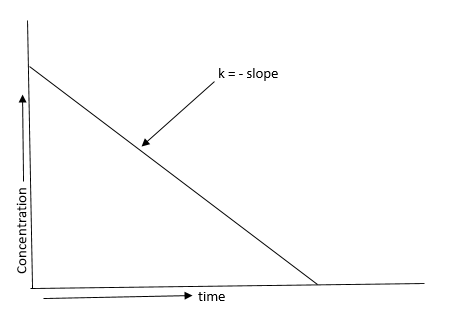
Answer & explanation
Correct answer: option 3
The correct answer is Option (3) → Zero order reaction
The order of a reaction can be read from the plot that gives a straight line. For a zero order reaction the rate does not depend on concentration:
\( \displaystyle -\frac{d[\mathrm{R}]}{dt} = k \)
Integrating gives:
\( \displaystyle [\mathrm{R}] = -kt + [\mathrm{R}]_0 \)
This has the form y = mx + c, so a plot of [R] against t is a straight line with slope = −k and intercept [R]0, as drawn.
Option (1) First order reaction — Incorrect. [R] falls exponentially with time, so [R] against t is a curve; only ln[R] against t is a straight line (slope −k).
Option (2) Second order reaction — Incorrect. [R] against t is also a curve; for a second order reaction 1/[R] against t is the straight line.
Option (4) Order can not be predicted from given graph — Incorrect. A straight-line [R] against t plot with slope −k is the identifying feature of a zero order reaction.
NCERT (2026-27 edition):
Zero Order Reactions – “… Comparing (3.6) with equation of a straight line, y = mx + c, if we plot [R] against t, we get a straight line (Fig. 3.3) with slope = –k and intercept equal to [R]0.”