
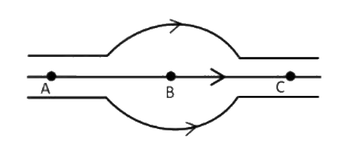
The figure given below shows some of the electric field lines of an electric field (E). The figure suggests that:
Answer & explanation
Correct answer: option 3
The correct answer is Option (3) → EA = EC > EB
The density of field lines (how closely they are packed) shows the strength of the electric field: where the lines are closer together the field is stronger.
From the figure, the lines are straight and equally close together at A and at C, so the field has the same strength at these points. Around B the outer lines spread apart, so fewer lines pass through a given area and the field is weaker.
\( E_A = E_C \gt E_B \)
NCERT (2026-27):
Electric Field Lines – “… Now the magnitude of the field is represented by the density of field lines. \( \mathbf{E} \) is strong near the charge, so the density of field lines is more near the charge and the lines are closer. Away from the charge, the field gets weaker and the density of field lines is less, resulting in well-separated lines.”