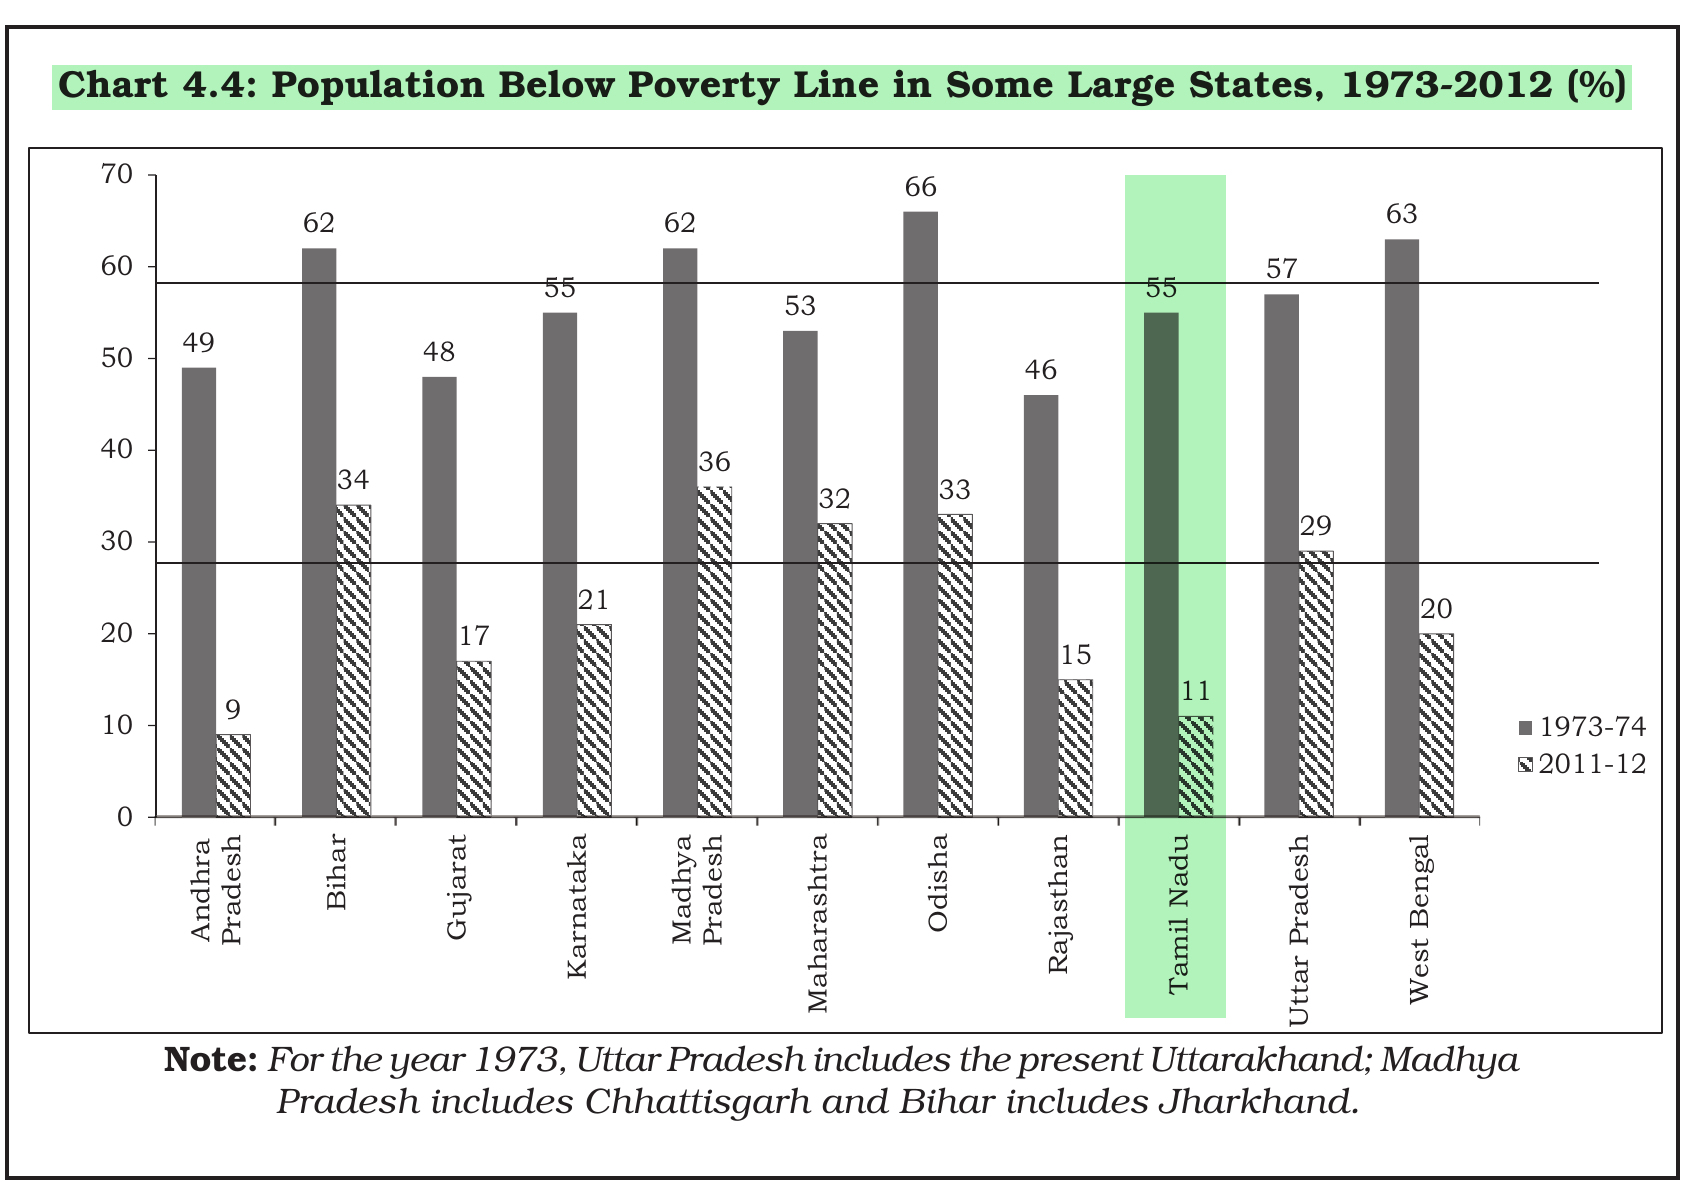
On the basis of the given diagram answer:
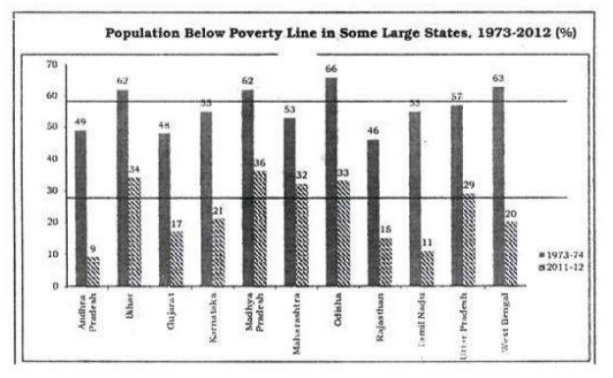
____________ state reduced poverty level much better than other states.
Answer & explanation
Correct answer: option 1
The correct answer is Option (1) → Tamil Nadu
Tamil Nadu brought the share of its people below the poverty line down from 55 per cent in 1973-74. It stood at 11 per cent in 2011-12. That is a fall of 44 percentage points, the largest among the four states.
Odisha: from 66 to 33 per cent, a fall of 33 points
Bihar: from 62 to 34 per cent, a fall of 28 points
Madhya Pradesh: from 62 to 36 per cent, a fall of 26 points
Note: This question is taken from the chapter ‘Poverty’ which was there in the pre-rationalised NCERT and has been deleted from subsequent editions of NCERT, including the NCERT book (2026-27). The chapter was also not in the CUET (UG) 2026 syllabus.
NCERT (Pre-rationalised): “4.4 The Number of Poor in India … The state level trends in poverty are shown in Chart 4.4. The two lines in the chart indicate the national poverty level. The first line from below indicates poverty level during 2011-12 and the other line indicates the same for the year 1973-74. This means, the proportion of poor in India during 1973-2012 has come down from 55 to 22 per cent. The chart also reveals that six states - Tamil Nadu, Uttar Pradesh, Bihar, Madhya Pradesh, West Bengal and Orissa - contained a large section of poor in 1973-74. During 1973-2012, many Indian states reduced the poverty levels to a considerable extent. Yet, the poverty levels in four states Odisha, Madhya Pradesh, Bihar and Uttar Pradesh are still far above the national poverty level. You may notice Andhra Pradesh, Rajasthan, West Bengal and Tamil Nadu reduced poverty level much better than other states.…”
|