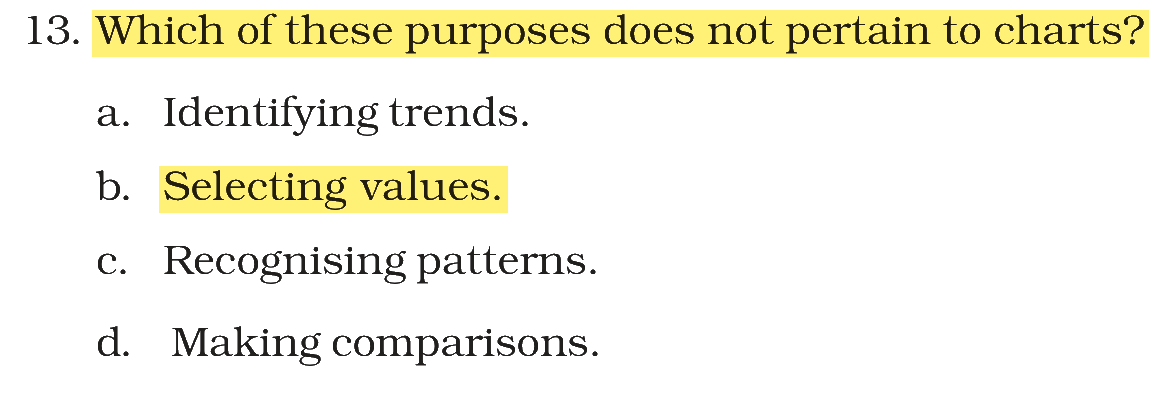
Which of these purposes does not pertain to charts?
Answer & explanation
Correct answer: option 2
The correct answer is Option (2) → Selecting value
Charts present data visually so that it can be understood at a glance: they are used to compare values, to see trends over time and to recognise patterns in the data. Selecting a value is done in the worksheet; it is not a purpose of a chart.
Option (1) Making Comparisons — A purpose of charts. Bars and columns make values easy to compare.
Option (2) Selecting value — Correct. It does not pertain to charts.
Option (3) Identifying trends — A purpose of charts. A line chart shows the trend in data over time.
Option (4) Recognising Patterns — A purpose of charts. Patterns that are hard to see in numbers stand out in a chart.
NCERT (2026-27 edition):
NCERT (2026-27 edition):
|