CUET Preparation Today
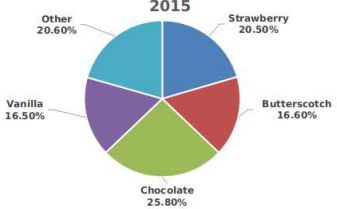
The given pie chart represents the popularity of ice-cream flavours in the year 2015.
In 2015, if the total sale of chocolate flavour is for ₹ 5,160, then the total sale (in ₹) for vanilla flavour is: |
4,100 4,120 3,300 5,160 |
3,300 |
ATQ , 25.80% of Total sale = 5160 Total sale = \(\frac{5160}{25.80}\) × 100 = 20000 Total sale of vanilla = 16.50% of 20000 = \(\frac{16.5}{100}\) × 20000 = 3300 |