CUET Preparation Today
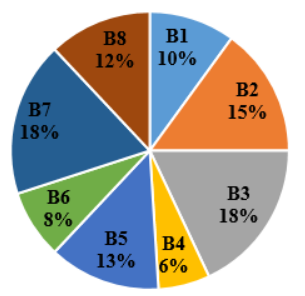
The following pie chart shows percentage figures of the number of cars sold of 8 different brands in a particular year.
If the total number of cars sold of these 8 brands taken together during the given year is 2800, then what is the difference between the numbers of cars sold of B2 and of B6? |
252 196 224 140 |
196 |
Difference between the numbers of cars sold of B2 and of B6 = \(\frac{15 - 8 }{100}\) × 2800 = \(\frac{7 }{100}\) × 2800 = 196 |