CUET Preparation Today
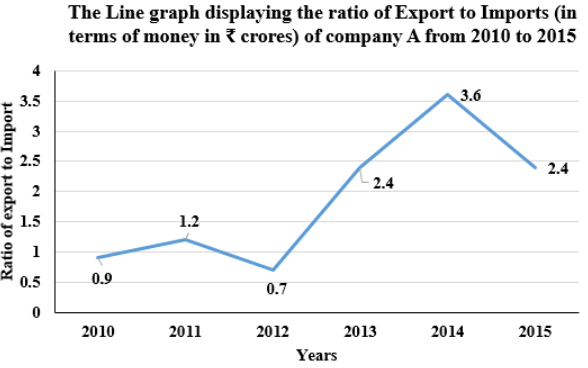
The following line graph displays the ratio of exports to imports (in terms of money in crores) of company A from 2010 to 2015. Study the graph carefully and answer the question based on the given line graph.
In how many years, the export of company A was more than the company's import? |
Four Two Six Three |
Four |
Ratio of export of company A more than import is for year 2011 , 2013 , 2014 , & 2015 i.e. 1.2 , 2.4 , 3.6 & 2.4 respectively. So , Ans = 4 |