
A graph for variation of photo current with anode potential is given for different intensities of incident radiation:
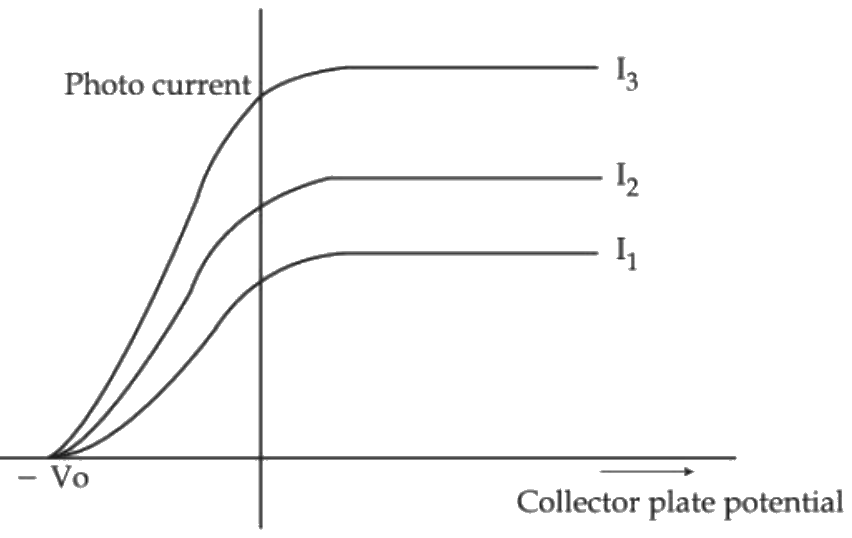
Choose the correct order of anode intensities.
Answer & explanation
Correct answer: option 3
The correct answer is Option (3) → \( I_1 \lt I_2 \lt I_3 \)
For light of a given frequency, the saturation photocurrent is proportional to the intensity of the incident light, because the number of photoelectrons emitted per second is proportional to the number of photons falling per second. The stopping potential depends only on the frequency, which is why all three curves meet the axis at the same \( -V_0 \).
Reading the saturation currents from the graph, the curve marked \( I_3 \) is the highest, then \( I_2 \), and \( I_1 \) is the lowest. Hence
\( \displaystyle I_1 \lt I_2 \lt I_3 \)
NCERT (2026-27):
Effect of Frequency of Incident Radiation on Stopping Potential – “… (ii) For a given photosensitive material and frequency of incident radiation, saturation current is found to be proportional to the intensity of incident radiation whereas the stopping potential is independent of its intensity (Fig. 11.3).”