CUET Preparation Today
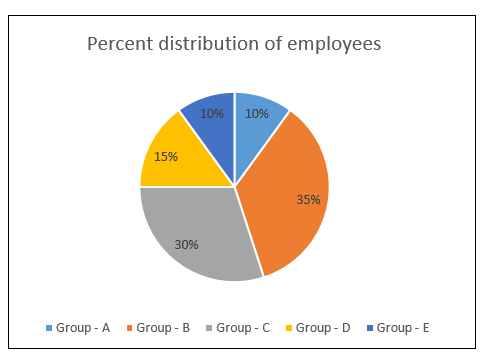
The percentage distribution of employees in different categories in a company is shown by the following pie chart
What is the central angle corresponding to the employees of Group-B ? |
130o 120o 126o 136o |
126o |
Central angle corresponding to the employees of Group-B = \(\frac{35}{100}\) × 360º = 126º |