
Which of the following graph plotted for the months against the three month moving average(3Yr MA) represents the given data correctly ?
| Month | January | February (F) | March (M) | April (A) | May |
| Production of items | 15 | 27 | 21 | 27 | 24 |
Answer & explanation
Correct answer: option 2
The correct answer is Option (2)
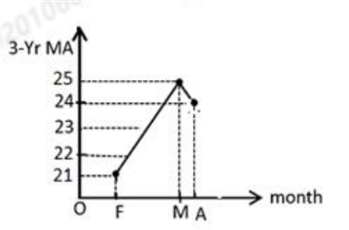
A three month moving average is the mean of three consecutive months, placed against the middle month. With five months of data there are three such averages, for February, March and April:
\( \displaystyle \text{February (F)}:\ \frac{15+27+21}{3}=\frac{63}{3}=21 \)
\( \displaystyle \text{March (M)}:\ \frac{27+21+27}{3}=\frac{75}{3}=25 \)
\( \displaystyle \text{April (A)}:\ \frac{21+27+24}{3}=\frac{72}{3}=24 \)
So the graph must pass through the points (F, 21), (M, 25) and (A, 24): it rises from 21 to 25 and then falls slightly to 24. Only the graph in Option (2) shows these values.
Why the other options are incorrect
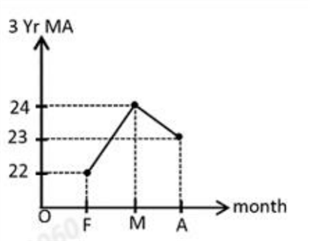
Option (1) — Incorrect. This graph shows 22, 24 and 23 at F, M and A; the averages are 21, 25 and 24.
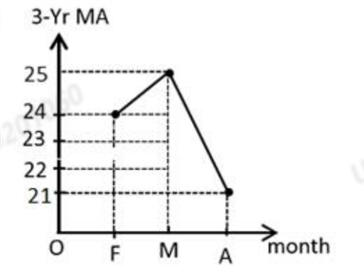
Option (3) — Incorrect. This graph shows 24, 25 and 21 at F, M and A; the values for February and April are interchanged.
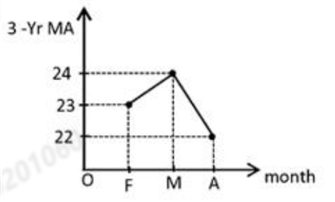
Option (4) — Incorrect. This graph shows 23, 24 and 22 at F, M and A; the averages are 21, 25 and 24.