CUET Preparation Today
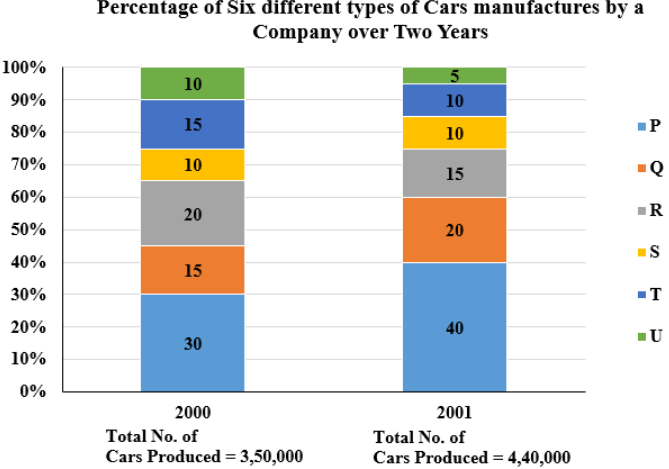
The bar graph given below shows the percentage distribution of the total production of six different types of cars by a car manufacturing company over 2 years.
The total number of cars of type P, R and U manufactured in 2001 is: |
1,54,000 1,76,000 2,00,000 2,64,000 |
2,64,000 |
Total number of cars manufactured in P , R & U = \(\frac{40 + 15 + 5}{100}\) × 440000 = \(\frac{3}{5}\) × 440000 = 264000 |