Target Exam

CUET

Subject

Economics

Chapter

Micro Economics: Production and Costs

Question:

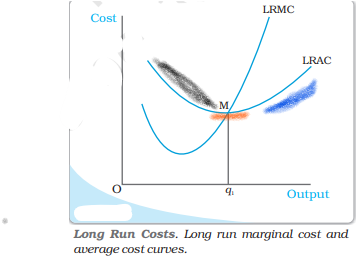
Study the given figure. The portion of LRAC curve highlighted by orange colour in the graph explains which concept?

Options:

Constant returns to Scale

Law of Variable Proportions

Cobb Douglas Production function

Law of Diminishing Marginal product

Correct Answer:

Constant returns to Scale

Explanation:

The correct answer is Option 1: Constant returns to Scale

  1. Understanding the LRAC Curve:

    • The LRAC curve represents the lowest possible cost at which a firm can produce any given level of output in the long run when all inputs are variable.
    • It is typically U-shaped due to economies and diseconomies of scale.
  2. Interpretation of the Orange Highlighted Portion:

    • The orange-highlighted portion is at the lowest point of the LRAC curve (M), where costs remain constant as output increases.
    • This implies that the firm is experiencing constant returns to scale, meaning that increasing input proportionally results in an equal proportional increase in output, keeping average cost unchanged.