The price and quantity at a point on the demand curve of a good are given as 10 and 50 respectively. If the price is changed to 6 and as a result quantity changes to 65, how do you explain the change?
Answer & explanation
Correct answer: option 4
The correct answer is Option (4) → Increase in quantity demanded
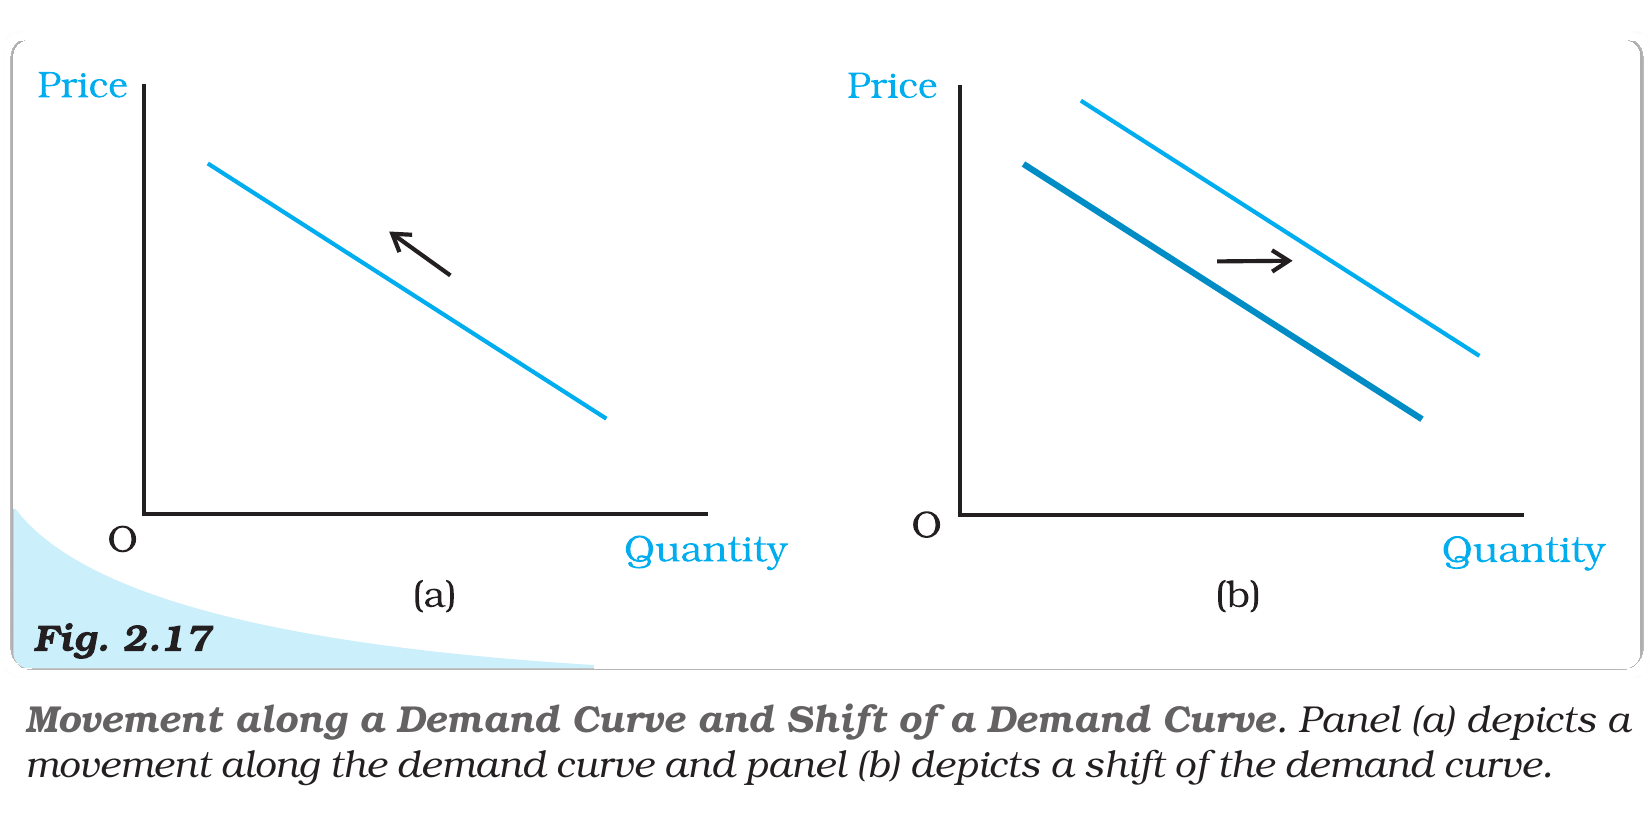
The price falls from 10 to 6, and the quantity rises from 50 to 65. Only the good’s own price has changed. So this is a movement along the same demand curve, called a rise in quantity demanded.
Option (1) Increase in demand for the good — Incorrect. This means the whole curve shifts to the right. A factor other than price has changed, such as income or tastes.
Option (2) Decrease in quantity demanded — Incorrect. This is also a movement along the curve, but it comes from a rise in price.
Option (3) Decrease in demand for the good — Incorrect. This means the whole curve shifts to the left, because a factor other than price has changed.
Option (4) Increase in quantity demanded — Correct. A lower price leads to a larger quantity on the same curve.
NCERT (2026-27): “2.4.6 Movements along the Demand Curve and Shifts in the Demand Curve As it has been noted earlier, the amount of a good that the consumer chooses depends on the price of the good, the prices of other goods, income of the consumer and her tastes and preferences. The demand function is a relation between the amount of the good and its price when other things remain unchanged. The demand curve is a graphical representation of the demand function. At higher prices, the demand is less, and at lower prices, the demand is more. Thus, any change in the price leads to movements along the demand curve. On the other hand, changes in any of the other things lead to a shift in the demand curve. Figure 2.17 illustrates a movement along the demand curve and a shift in the demand curve.”
|