CUET Preparation Today
Study the given graph and answer the question that follows.
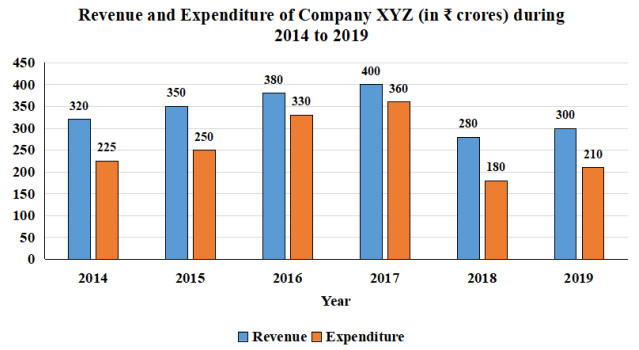
The total revenue of the company in 2014, 2016 and 2018 is what percentage of the total expenditure in 2015 to 2017 and 2019 (correct to one decimal place)? |
85.2% 84.3% 83.4% 81.6% |
85.2% |
Total revenue of the company in 2014, 2016 and 2018 = 320 + 380 + 280 = 980 Total expenditure in 2015 to 2017 and 2019 = 250 + 330 + 360 + 210 = 1150 Required percentage = \(\frac{980 }{1150}\) × 100 = 85.2%
|