CUETMOCK
  • Pricing
  • Mentors
Log inStart freeStart free mocks→

First test, then trust

Try a free CUET mock test.

Join 5,00,000+ students who rehearsed exam day on the exact NTA screen before sitting CUET. On the web and on Android.

Start free mocks →Get the Android app
CUETMOCK

India's #1 CUET Mock Test Platform. Original NCERT-based questions on the exact NTA exam screen — trusted by 5,00,000+ students since CUET 2022.

Get it onGoogle PlayScan to download the CUETMOCK app

Mock tests

  • CUET mock test series
  • Commerce mocks
  • Humanities (Arts) mocks
  • Science mocks
  • Languages & GAT mocks
  • Free practice questions
  • Pricing

Resources

  • CUET exam guide
  • CUET syllabus
  • Universities accepting CUET
  • Expert blogs
  • News & notifications
  • Webinars & counselling
  • CUET score calculator
  • How we estimate your rank
  • FAQs

Company

  • About us
  • Our leadership & team
  • Our toppers
  • Mentors
  • For schools
  • Contact us
  • Terms
  • Privacy
  • Refund policy

Talk to us

+91 7696 6630 56info@cuetmock.comWhatsApp us

Our other platforms

  • JEE Mock — For IIT-JEE aspirants
  • NEET Mock — For NEET aspirants

Newsletter

Exam updates, study material and offers — no spam.

© 2026 NYC Ventures Pvt. Ltd.

701-702, Royal Business Park, Zirakpur, Punjab - 140603

  • Terms of use
  • Privacy policy
  • Refund policy
  • Contact us

iCUETMOCK is an independent preparation platform, not affiliated with the National Testing Agency (NTA). Always check exam details on the official NTA website.

  • Home
  • Mock tests
  • CUET guide
  • Pricing
  • Log in
Home/Practice questions/Sociology
SociologyIndian Society: Demographic Structure of Indian Society

Choose the correct statements related to demographic dividend:A. High…

Choose the correct statements related to demographic dividend:

A. Higher dependency ratio means that the population is young.

B. Lower dependency ratio creates the potential for generating growth.

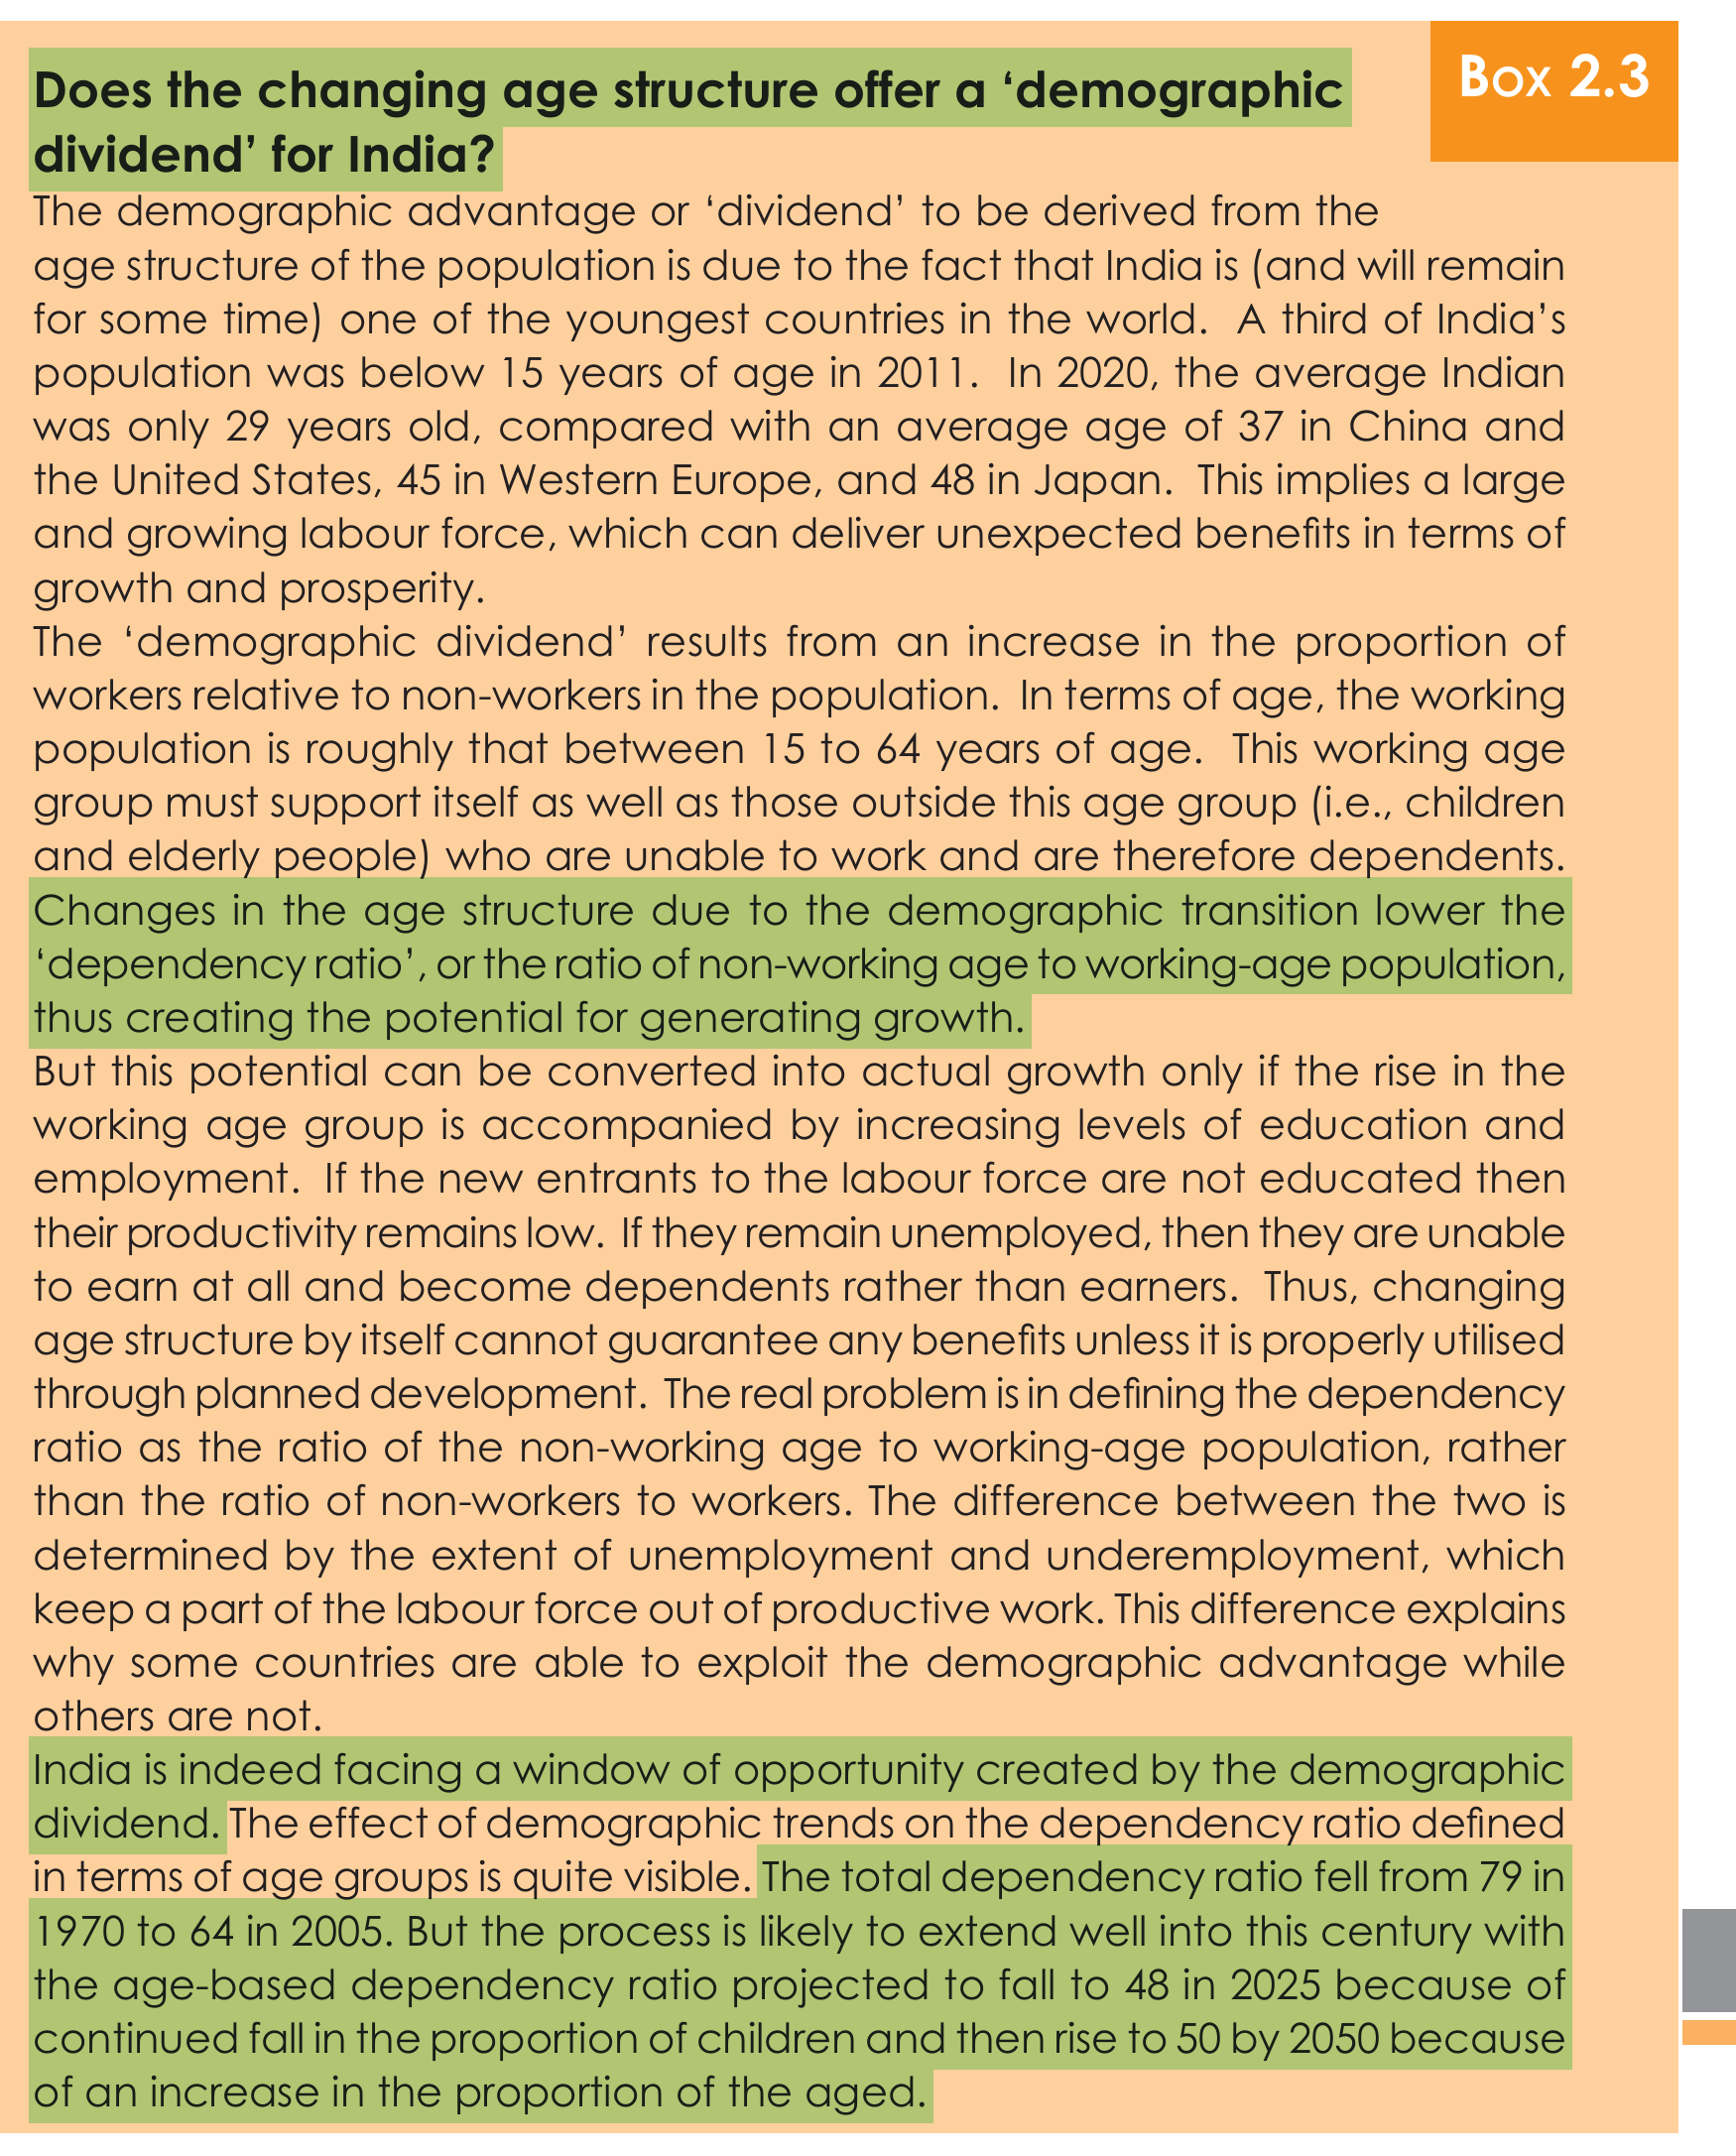
C. The total dependency ratio fell from 79 in 1970 to 64 in 2005.

D. Age-based dependency ratio in India is projected to fall to 50 by 2050.

Choose the correct answer from the options given below:

Answer & explanation+

Correct answer: option 1

The correct answer is Option (1) → B, C and D only

A. Higher dependency ratio means that the population is young. Incorrect. The dependency ratio compares the dependents, children who are too young to work and elderly people who are too old to work, with the people of working age (15 to 64 years). A high ratio can come from many old people as well as from many children; a rising ratio is in fact a worry for countries with an ageing population. So a higher ratio does not by itself mean that the population is young.

B. Lower dependency ratio creates the potential for generating growth. Correct. When the ratio falls, there are more workers for every non-worker. The demographic transition lowers the ratio and so creates the potential for generating growth; this is the demographic dividend. The potential turns into actual growth only if the new workers are educated and find jobs.

C. The total dependency ratio fell from 79 in 1970 to 64 in 2005. Correct. These are the very figures given for India: the total dependency ratio fell from 79 in 1970 to 64 in 2005.

D. Age-based dependency ratio in India is projected to fall to 50 by 2050. Correct. The age-based ratio is projected to fall to 48 in 2025, as the share of children keeps falling, and then to rise to 50 by 2050, as the share of the aged grows. Compared with 64 in 2005, a ratio of 50 in 2050 is still a fall, which is how the statement puts it.

Note: Statement D is loosely worded. NCERT (2025-26) projects the age-based dependency ratio to fall to 48 in 2025 and then rise to 50 by 2050; the statement says only that it falls to 50 by 2050. Read against the 2005 figure of 64, the ratio of 50 in 2050 is lower. Without statement D no option fits, since ‘B and C only’ is not given; so statement D is taken as correct, as per the NTA answer key.


NCERT (2025-26): “Common Concepts and Indicators … The dependency ratio is a measure comparing the portion of a population which is composed of dependents (i.e., elderly people who are too old to work, and children who are too young to work) with the portion that is in the working age group, generally defined as 15 to 64 years. The dependency ratio is equal to the population below 15 or above 64, divided by population in the 15-64 age group. This is usually expressed as a percentage. A rising dependency ratio is a cause for worry in countries that are facing an ageing population, since it becomes difficult for a relatively smaller proportion of working-age people to carry the burden of providing for a relatively larger proportion of dependents. On the other hand, a falling dependency ratio can be a source of economic growth and prosperity due to the larger proportion of workers relative to non-workers. This is sometimes refered to as the ‘demographic dividend’, or benefit flowing from the changing age structure. However, this benefit is temporary because the larger pool of working age people will eventually turn into non-working old people.”

NCERT extract

Advertisement

Practise more on Indian Society: Demographic Structure of Indian Society

Chapter-wise mocks on the real NTA exam screen, with solutions and your rank. Your first mocks are free.

Start free mocks →

Advertisement

Next questions

  1. In a survey of 500 households of a city, the mean monthly electricity bill of these 500 households is found to be Rs. 1,840. The value Rs.…Applied Maths. Section B2 · Inferential Statistics
  2. Shaikh Itisamuddin and Mirza Abu Talib visited Europe and tried to change the image Europeans had of Indian society. When did such visits t…History · Medieval India: Through the Eyes of Travellers
  3. ∫_1^4fracx[x] dx is equal to[Where x = fractional part function and [x] = greatest integer function]Maths. Section B1 · Definite Integration
  4. निम्नलिखित में से कौन-सा विलोम युग्म नहीं है?Hindi · विलोम शब्द
  5. The area (in square units) bounded by the curve y=x^2|x| , x -axis and the lines x=-2 and x=2 , isMaths. Section B1 · Application of Integrals
  6. Match List-I with List-II.List-I (Idioms)List-II (Meanings)(A) Back to the drawing board(I) to stay alert to news and signs of what is abou…English · Grammar: Idioms
  7. Given below are two statements: Statement I: During pregnancy all events of the menstrual cycle stop and there is no menstruation. Statemen…Biology · Human Reproduction
  8. Artists of the Bengal School and its time worked in different ways. Match the practices in List-I with the artists in List-II.List-I (Pract…Fine Arts · The Bengal School and Cultural Nationalism
  9. Six cousins, Arnav, Bhavya, Chandni, Daksh, Eshaan and Falak, are sitting around a round table, facing the centre. Daksh sits second to the…General Aptitude Test · Verbal Reasoning
  10. Assertion (A): The production of synthetic human insulin through recombinant DNA technology has provided a safer source of insulin for diab…Biology · Biotechnology and its Applications