CUET Preparation Today
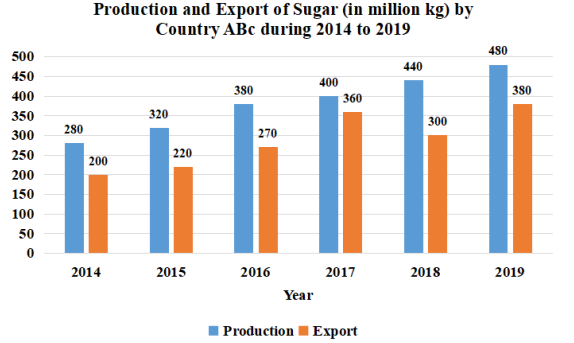
Study the given graph and answer the question that follows.
For which of the following years was the increase in the production of sugar as compared to that in its preceding year between 8% and 10% ? |
2018 2017 2019 2015 |
2019 |
Lets solve one by one for each option . 1. 2018 Percentage increase in production in 2018 as compared to 2017 = \(\frac{440-400 }{400}\) × 100 = \(\frac{40 }{400}\) × 100 = 10% 2. 2017 Percentage increase in production in 2017 as compared to 2016 = \(\frac{400-380 }{380}\) × 100 = \(\frac{20 }{380}\) × 100 = 5.26% 3. 2019 Percentage increase in production in 2019 as compared to 2018 = \(\frac{480-440 }{440}\) × 100 = \(\frac{40 }{440}\) × 100 = 9.09% 4. 2015 Percentage increase in production in 2015 as compared to 2014 = \(\frac{320-280 }{280}\) × 100 = \(\frac{40 }{280}\) × 100 = 14.28% So , Percentage increase in production in 2019 as compared to 2018 falls b/w 8% and 10%. Ans :- 2019 |