CUET Preparation Today
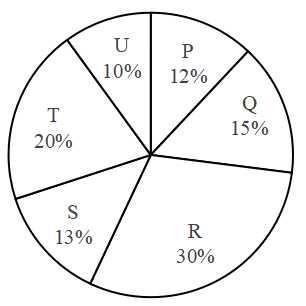
The pie chart given below shows the production of 6 different factories. The total production of all these 6 factories is 12000. The production of a particular factory is shown as a percent of total production of all these 6 factories.
J1 = The value of average production of P and R. J2 = The value of average production of Q and T. What is the value of (J1 - J2)? |
360 420 340 400 |
420 |
Total production of P & R = (12% + 30%) = 42% of 1200 = \(\frac{42}{100}\) × 12000 = 5040 J1 = The value of average production of P and R = \(\frac{5040}{2}\) = 2520 Total production of Q & T = ( 15% + 20% ) = 35% of 12000 = \(\frac{7}{20}\) × 12000 = 4200 J2 = The value of average production of Q and T = \(\frac{4200}{2}\) = 2100 Now , (J1 - J2) = 2520 - 2100 = 420 |