
The figure shows the plot of the molar conductivity (Λm) of KCl solutions against c1/2 at 298 K.
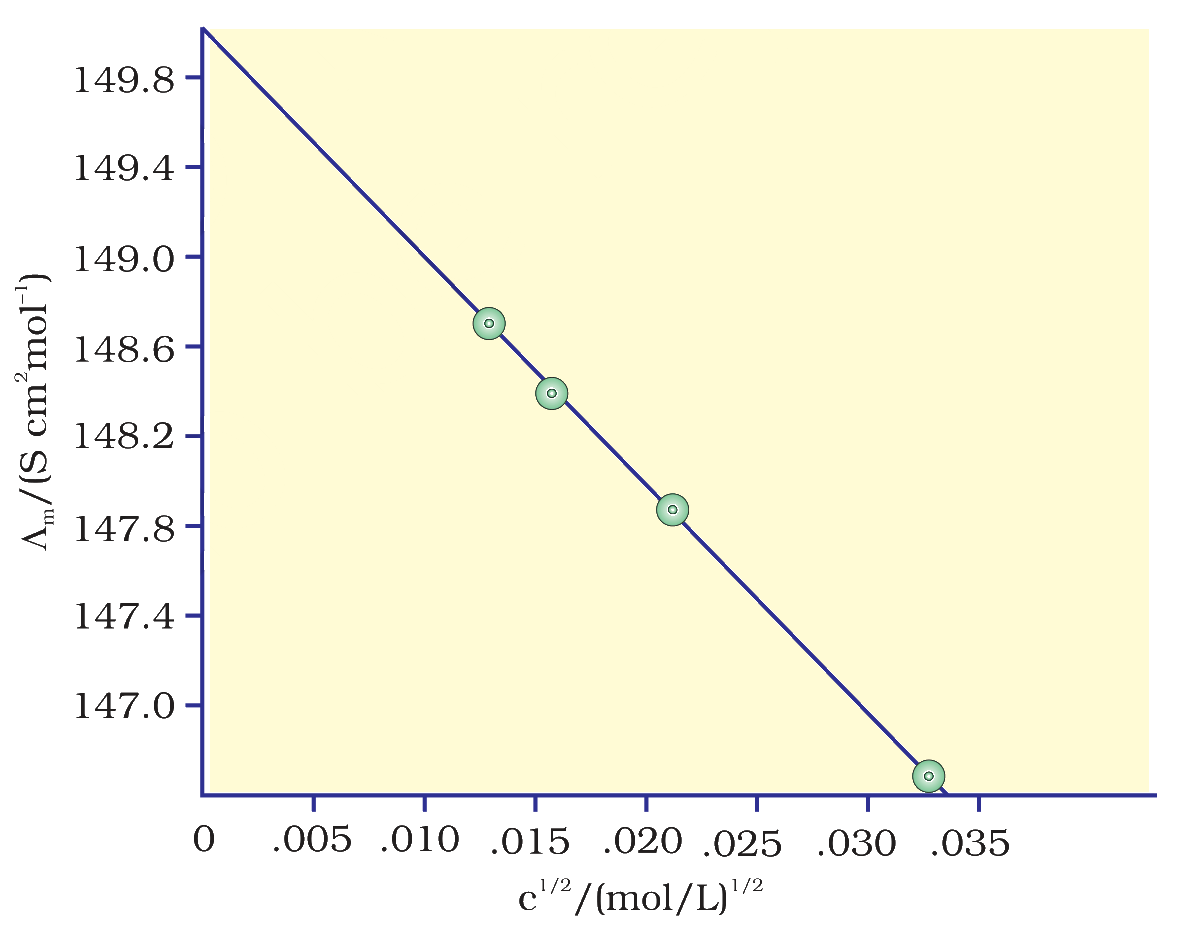
What is the limiting molar conductivity (Λ°m) of KCl obtained from this plot?
Answer & explanation
Correct answer: option 1
The correct answer is Option (1) → 150.0 S cm2 mol−1
For a strong electrolyte such as KCl, Λm = Λ°m when c1/2 = 0, so Λ°m is the intercept of the line on the Λm axis:
\( \Lambda_m = \Lambda_m^{\circ} - A\,c^{1/2} \)
In the figure, the line meets the Λm axis (c1/2 = 0) at 150.0 S cm2 mol−1.
Λ°m(KCl) = 150.0 S cm2 mol−1
NCERT (2026-27 edition):
2.4.2 Variation of Conductivity and Molar Conductivity with Concentration – “…It can be seen that if we plot (Fig. 2.6) Λm against c1/2, we obtain a straight line with intercept equal to Λ°m and slope equal to ‘–A’.”
Example 2.6 – “…A plot of Λm (y-axis) and c1/2 (x-axis) is shown in (Fig. 2.7). It can be seen that it is nearly a straight line. From the intercept (c1/2 = 0), we find that Λ°m = 150.0 S cm2 mol–1 and A = – slope = 87.46 S cm2 mol–1/(mol/L–1)1/2.”
Fig. 2.7: Variation of Λm against c½.