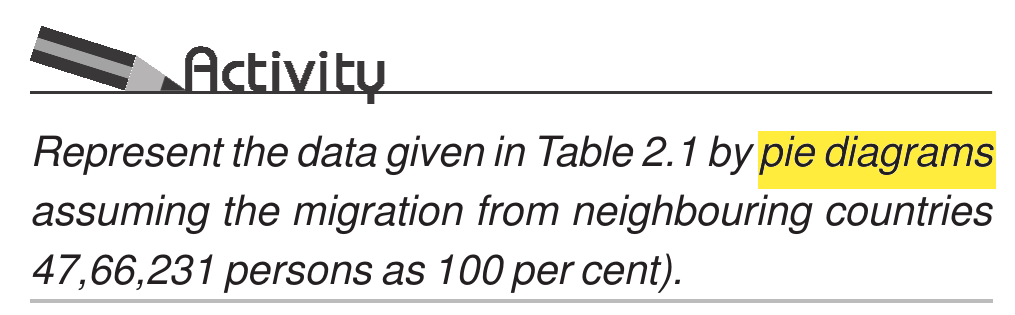
Study the given diagram and answer the following question.
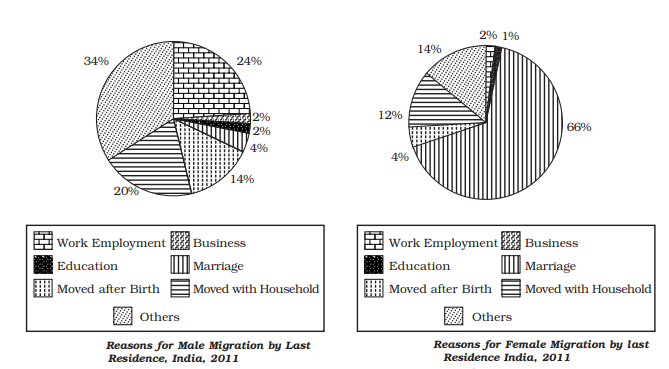
The diagram used to represent the relative share of reasons of migration is known as __________.
Answer & explanation
Correct answer: option 2
The correct answer is Option (2) → Pie diagram
Both diagrams are circles cut into slices. Each slice shows the share of one reason, and the whole circle is 100 per cent. Such a diagram is a pie diagram.
Note: This question is taken from the pre-rationalised NCERT book. The latest edition (2026-27) does not have this part. An extract of the pre-rationalised NCERT book is given below for the benefit of students.
Pre-rationalised NCERT:
Box: Activity (Chapter 2: Migration: Types, Causes and Consequences) |