CUET Preparation Today
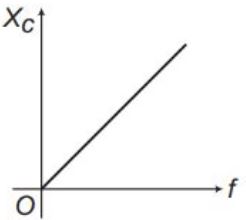
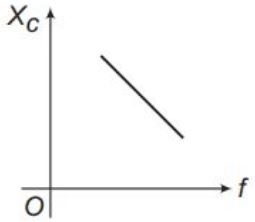
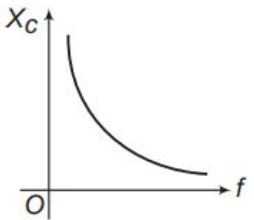
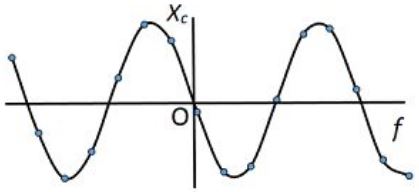
Identify the graph which correctly represents the variation of capacitive reactance ($X_C$) with frequency ($f$) |
|
|
The correct answer is Option (3) →
Capacitive reactance is given by: $X_C = \frac{1}{2 \pi f C}$ Hence, $X_C$ is inversely proportional to frequency ($f$). As frequency increases, capacitive reactance decreases. Variation: $X_C \propto \frac{1}{f}$ Graph: A rectangular hyperbola decreasing with increase in frequency. |