
The table shows the number of cars sold by dealers P, Q, R, S and T during the first six months of 2022.
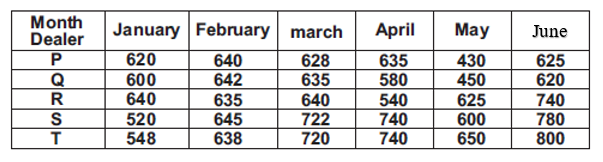
What is the ratio of the total number of cars sold by Q in January, April and June to the total number of cars sold by dealers P and S in March?
Answer & explanation
Correct answer: option 1
The correct answer is Option (1) → 4 : 3
Each side of the ratio is a sum of table entries; the ratio is then reduced by the common factor.
Q in January, April and June \(=600+580+620=1800\)
P and S in March \(=628+722=1350\)
\(1800:1350\); dividing both by 450 gives \(4:3\)