CUET Preparation Today
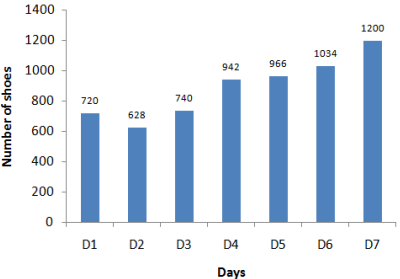
The Bar graph given below presents the number of shoes manufactured by a company on the different days of a week.
The number of shoes manufactured on D1 is what percentage of shoes manufactured on D7? |
80.45 60 80 70.25 |
60 |
Number of shoes manufactured in D1 = 720 Number of shoes manufactured in D7 = 1200 Required difference = \(\frac{720 }{1200}\) × 100 = 60% |