
In the species-area relationship (log S = log C + Z log A), what does Z represent?
Answer & explanation
Correct answer: option 1
The correct answer is Option (1) → Slope of the line (regression coefficient)
Within a region, species richness rises with area, but only up to a limit. On a logarithmic scale this relationship becomes a straight line, log S = log C + Z log A. Z is the slope of the line, also called the regression coefficient. For most groups and regions its value lies between 0.1 and 0.2, while for very large areas such as continents the slope is much steeper.
Option (1) Slope of the line (regression coefficient) — Correct. Z is the slope of the regression line; it shows how fast the number of species rises as the area increases.
Option (2) Y-intercept — Incorrect. The Y-intercept of the line is C.
Option (3) Species richness — Incorrect. Species richness is S, the quantity on the y-axis.
Option (4) Area — Incorrect. Area is A, the quantity on the x-axis.
NCERT Extract:
Patterns of Biodiversity – “… On a logarithmic scale, the relationship is a straight line described by the equation log S = log C + Z log A where S= Species richness A= Area Z = slope of the line (regression coefficient) C = Y-intercept”
Patterns of Biodiversity – “… Ecologists have discovered that the value of Z lies in the range of 0.1 to 0.2, regardless of the taxonomic group or the region (whether it is the plants in Britain, birds in California or molluscs in New York state, the slopes of the regression line are amazingly similar).”
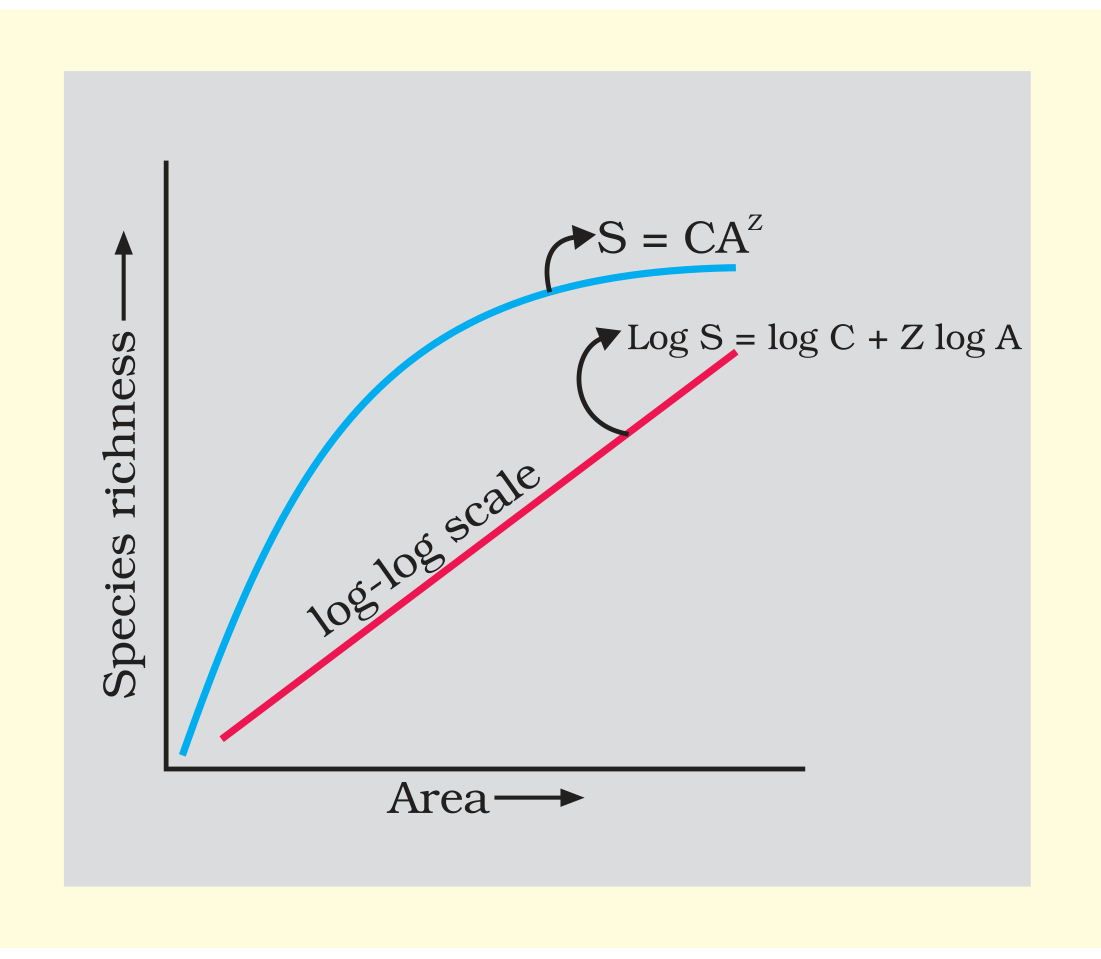
Figure 13.2 Showing species area relationship. Note that on log scale the relationship becomes linear