
CUETMOCK
  • Pricing
  • Mentors
Log inStart freeStart free mocks→

First test, then trust

Try a free CUET mock test.

Join 5,00,000+ students who rehearsed exam day on the exact NTA screen before sitting CUET. On the web and on Android.

Start free mocks →Get the Android app
CUETMOCK

India's #1 CUET Mock Test Platform. Original NCERT-based questions on the exact NTA exam screen — trusted by 5,00,000+ students since CUET 2022.

Get it onGoogle PlayScan to download the CUETMOCK app

Mock tests

  • CUET mock test series
  • Commerce mocks
  • Humanities (Arts) mocks
  • Science mocks
  • Languages & GAT mocks
  • Free practice questions
  • Pricing

Resources

  • CUET exam guide
  • CUET syllabus
  • Universities accepting CUET
  • Expert blogs
  • News & notifications
  • Webinars & counselling
  • CUET score calculator
  • How we estimate your rank
  • FAQs

Company

  • About us
  • Our leadership & team
  • Our toppers
  • Mentors
  • For schools
  • Contact us
  • Terms
  • Privacy
  • Refund policy

Talk to us

+91 7696 6630 56info@cuetmock.comWhatsApp us

Our other platforms

  • JEE Mock — For IIT-JEE aspirants
  • NEET Mock — For NEET aspirants

Newsletter

Exam updates, study material and offers — no spam.

© 2026 NYC Ventures Pvt. Ltd.

701-702, Royal Business Park, Zirakpur, Punjab - 140603

  • Terms of use
  • Privacy policy
  • Refund policy
  • Contact us

iCUETMOCK is an independent preparation platform, not affiliated with the National Testing Agency (NTA). Always check exam details on the official NTA website.

  • Home
  • Mock tests
  • CUET guide
  • Pricing
  • Log in
Home/Practice questions/Chemistry
ChemistryPhysical: Chemical Kinetics

The figure shows the distribution of kinetic energy among the molecul…

The figure shows the distribution of kinetic energy among the molecules of a reacting gas at a temperature t and at (t + 10), with the energy of activation marked on it.
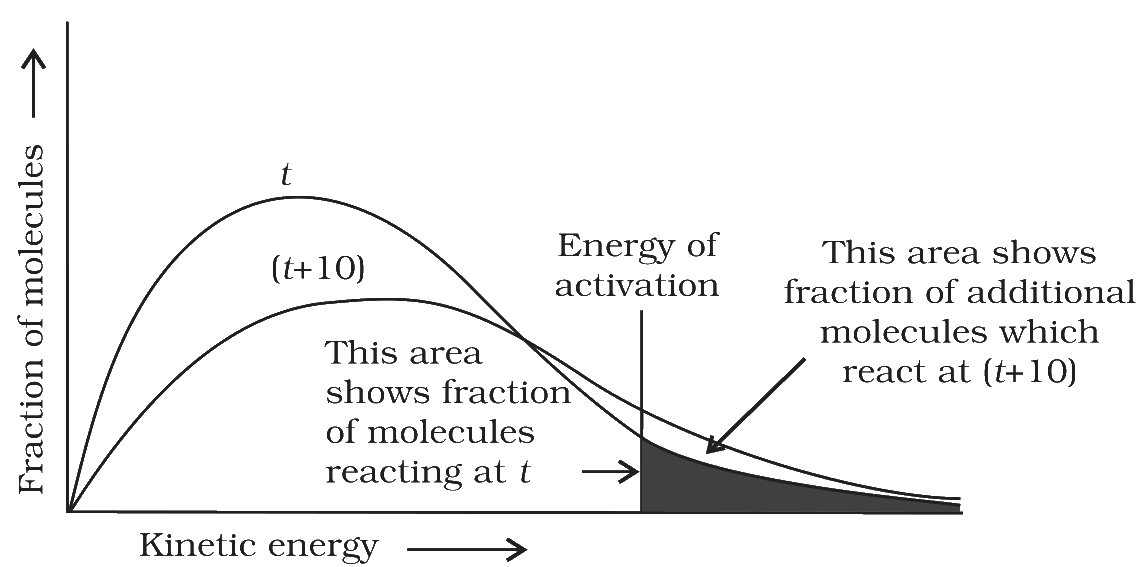
Distribution curves at t and (t+10) with the energy of activation marked

The gas is now heated further, to (t + 20). For this reaction, the rate constant nearly doubles for every 10° rise in temperature. Which of the following describes the curve at (t + 20) compared with the curve at t?

Answer & explanation+

Correct answer: option 3

The correct answer is Option (3) → The maximum of the curve is lower than at t, and the fraction of molecules having energy equal to or greater than the activation energy is about four times that at t.

The curves plot the fraction of molecules against their kinetic energy. Only the molecules lying to the right of the Ea line can react, and the Ea line stays where it is when the gas is heated.

  • Height of the maximum — Lower than at t. In the figure, going from t to (t + 10), the peak becomes lower and moves to a higher kinetic energy, and the curve spreads to the right. The total area under the curve stays the same, so a curve that spreads out must become flatter. At (t + 20) the same change goes one step further: the maximum is lower still and lies at a still higher energy.

  • Fraction beyond Ea — About four times that at t. In the Arrhenius equation the factor e−Ea/RT is the fraction of molecules with energy greater than Ea, so this fraction rises in step with the rate constant. The figure shows it for one 10° rise: the shaded area at t plus the area of additional molecules at (t + 10) makes the fraction double. Each further 10° rise doubles it again:

        t → (t + 10): 1 × 2 = 2 times

        (t + 10) → (t + 20): 2 × 2 = 4 times the fraction at t

Why the other options are incorrect

Option (1) The maximum of the curve is taller than at t, and the fraction of molecules having energy equal to or greater than the activation energy is about three times that at t. — Incorrect. Both parts are wrong:

  • A taller peak would need a larger total area or a narrower curve, which is the opposite of what the figure shows.

  • Adding the same extra area once more gives 3 times; the change is a doubling of whatever fraction is present, not a fixed addition.

Option (2) The maximum of the curve is lower than at t, and the fraction of molecules having energy equal to or greater than the activation energy is about three times that at t. — Incorrect. The maximum is lower, but adding the same extra area once more gives 3 times; the change is a doubling of whatever fraction is present, not a fixed addition.

Option (4) The maximum of the curve is taller than at t, and the fraction of molecules having energy equal to or greater than the activation energy is about four times that at t. — Incorrect. The fraction is about four times, but a taller peak would need a larger total area or a narrower curve, which is the opposite of what the figure shows.

NCERT (2026-27 edition):
3.4 Temperature Dependence of the Rate of a Reaction – “It has been found that for a chemical reaction with rise in temperature by 10°, the rate constant is nearly doubled.”

“When the temperature is raised, the maximum of the curve moves to the higher energy value (Fig. 3.9) and the curve broadens out, i.e., spreads to the right such that there is a greater proportion of molecules with much higher energies. The area under the curve must be constant since total probability must be one at all times.”

“It is clear from the diagram that in the curve at (t + 10), the area showing the fraction of molecules having energy equal to or greater than activation energy gets doubled leading to doubling the rate of a reaction.”

“In the Arrhenius equation (3.18) the factor e–Ea/RT corresponds to the fraction of molecules that have kinetic energy greater than Ea.”

Fig. 3.9

Fig. 3.9: Distribution curve showing temperature dependence of rate of a reaction

Advertisement

Practise more on Physical: Chemical Kinetics

Chapter-wise mocks on the real NTA exam screen, with solutions and your rank. Your first mocks are free.

Start free mocks →

Advertisement

Next questions

  1. For a first-order reaction R → P, match List-I with List-II.List-IList-II(A) Slope of the straight-line plot of ln[R] against t(I) k/2.303…Chemistry · Physical: Chemical Kinetics
  2. A current-carrying wire is placed parallel to the magnetic field lines in a uniform magnetic field. ThenPhysics · Moving Charges and Magnetism
  3. For the function f(x) = x^4 - 4x^3 , x ∈ R : (A) x = 0 is a point of local maximum.(B) x = 3 is a point of local minimum.(C) The local mini…Maths. Section B1 · Applications of Derivatives
  4. Bahadur Shah Zafar was the last Mughal ruler. After the failure of the Indian Revolt of 1857, to which place did the British exile him?Fine Arts · The Mughal School of Miniature Painting
  5. At the time of dissolution of their firm, Ahmed and Subhash, who are partners of that firm, agreed that Ahmed will pay realization expenses…Accountancy Part A · Dissolution of Partnership Firm
  6. Arrange the following Presidents in a chronological order from the earliest to the last.(A) Shri V. V. Giri(B) Dr. Zakir Hussain(C) Dr. Sar…General Aptitude Test · General Knowledge
  7. Which of the following is not a fibrous protein?Chemistry · Organic: Biomolecules
  8. In a model of a town, six buildings, a library, a museum, a bank, a hospital, a school and a temple, have different heights. The library is…General Aptitude Test · Verbal Reasoning
  9. AB and CD are two equal chords of a circle with centre O. The chord AB is at a distance of 12 cm from O, and CD =18 cm. What is the radius…General Aptitude Test · Quantitative Reasoning
  10. The GDP at market prices of a country is Rs 6,000 crore. Indirect taxes are Rs 700 crore and subsidies are Rs 200 crore. What is its GDP at…Economics · Macro Economics: National Income Accounting