CUET Preparation Today
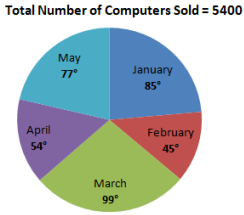
Study the pie chart and answer the question. Distribution (degree wise) of the number of computers sold by a shopkeeper during five months.
The total number of computers sold in February and April is what percentage more than the number of computers sold in May? (Your answer should be correct to one decimal place.) |
28.6 26.4 30.2 25.8 |
28.6 |
Number of computers sold in February & April = \(\frac{45º + 54º }{360º}\) × 5400 = \(\frac{99º }{360º}\) × 5400 = 1485 Computers sold in May = \(\frac{77º }{360º}\) × 5400 = 1155 Required percentage = \(\frac{1485 - 1155 }{1155}\) × 100 = \(\frac{ 330 }{1155}\) × 100 = 28.6% |