CUET Preparation Today
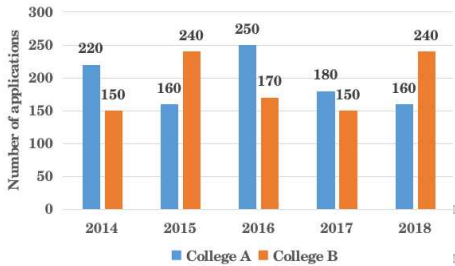
Study the following bar graph and answer the question given below. The bar graph represents the total number of applications received for B.Sc. Mathematics by two different colleges A and B in 5 different years.
In 2015, out of the total number of applications received by colleges A and B together, only 60% were accepted. What were the total number of applications accepted by colleges A and B together in 2015? |
250 260 240 180 |
240 |
Total number of applications accepted from college A and B in 2015 = 160 + 240 = 400 Accepted applications from college A and B in 2015 = \(\frac{60 }{100}\) × 400 = \(\frac{3 }{5}\) × 400 = 240 |