CUET Preparation Today
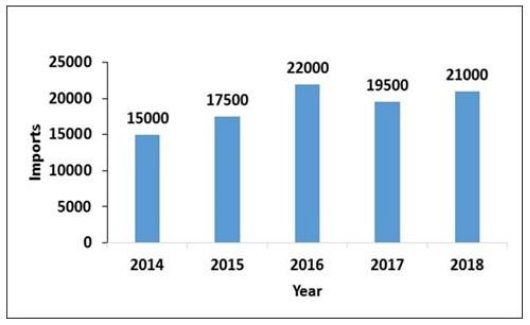
The following Bar chart presents the quantity (in million kg) of imports of a particular item made by India during 2014-2018. For how many years, is the quantity imported less than the overall average of imports of the said item during the given period?
|
4 2 1 3 |
2 |
Average import = \(\frac{15000 + 17500 + 22000 + 19500 + 21000}{5}\) = \(\frac{ 95000}{5}\) = 19000 Export in 2014 and 2015 is less than average export over all years . Ans :- 2 |