CUET Preparation Today
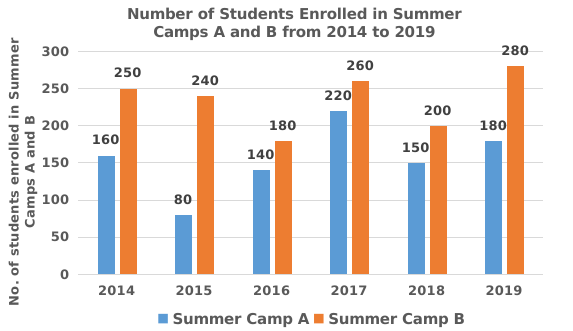
The following bar chart shows the number of students enrolled in two Summer Camps A and B from 2014 to 2019. Study the chart carefully and answer the question that follows.
What is the ratio of the students enrolled in Camp A in 2014, 2016 and 2017 to the students enrolled in camp B in 2015, 2018 and 2019 ? |
18 : 13 22 : 15 13 : 18 15 : 22 |
13 : 18 |
Students in camp A in 2014 , 2016 & 2017 : Students in camp B in 2015 , 2018 & 2019 ( 160 + 140 + 220 ) : (240 + 200 + 280 ) 520 : 720 13 : 18
|