CUET Preparation Today
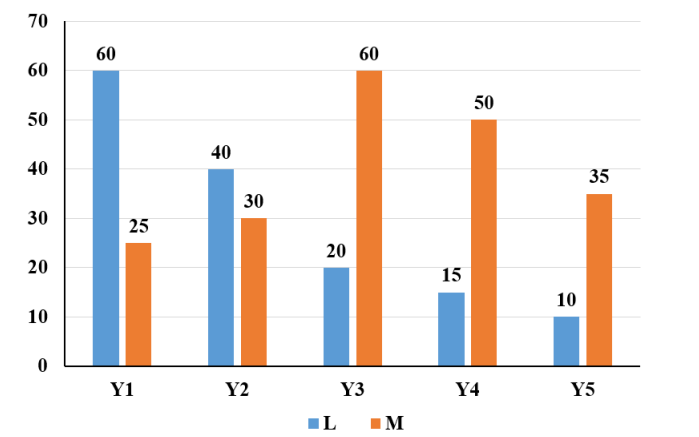
The bar graph given below shows production of truck by two companies L and M in 5 years.
Which of the following statement is NOT correct? I. The production of truck by company L in year Y1 is 24 percent of the production of company M in year Y1. II. The ratio of production of truck by company L in year Y4 to the production of truck by company M in year Y4 are 10 : 3. lll. The average production of truck by company L in year Y2 and Y3 are 30.
|
Only ll Only l ll and lll l and ll |
l and ll |
I. The production of truck by company L in year Y1 is 24 percent of the production of company M in year Y1. Required percentage = \(\frac{60}{25}\) × 100 = 240% Statement I is not correct. II. The ratio of production of truck by company L in year Y4 to the production of truck by company M in year Y4 are 10 : 3. Production by L in Y4 : Production by M in Y4 15 : 50 3 : 10 Statement II is not correct . lll. The average production of truck by company L in year Y2 and Y3 are 30. = \(\frac{40 + 20}{2}\) = 30 Statement III is correct. ANs:- I and II |