CUET Preparation Today
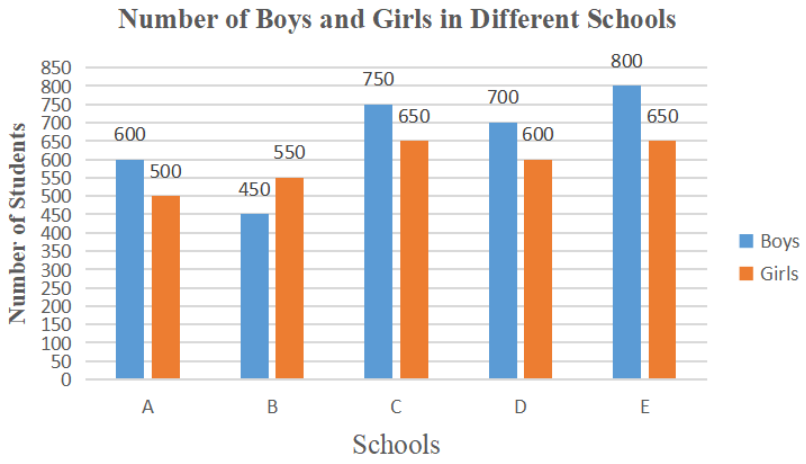
The given bar graph represents the number of boys and girls in five different schools. Study the graph and answer the question that follows.
In which school is the percentage of girls the lowest? |
B A E C |
E |
By checking one by one for all the 4 option 1. B Percentage of Girls = \(\frac{550}{1000}\) × 100 = 55% 2. A Percentage of Girls = \(\frac{500}{1100}\) × 10045.45% 3. E Percentage of Girls = \(\frac{650}{1450}\) × 100= 44.83% 4. C Percentage of Girls = \(\frac{650}{1400}\) × 100 = 46.43% So , E has lowest percentage of girls. |