CUET Preparation Today
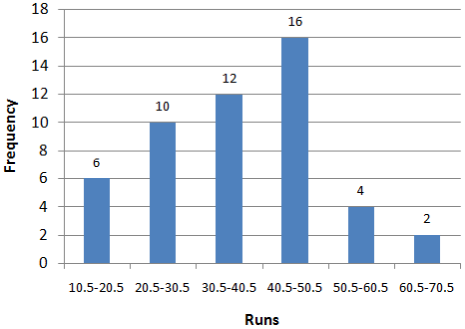
The given histogram represents the frequency distribution of average runs scored by 50 selected players from a district in a local cricket tournament.
Which class of boundaries does the frequency of ‘10’ correspond to? |
30.5 to 40.5 40.5 to 50.5 20.5 to 30.5 10.5 to 20.5 |
20.5 to 30.5 |