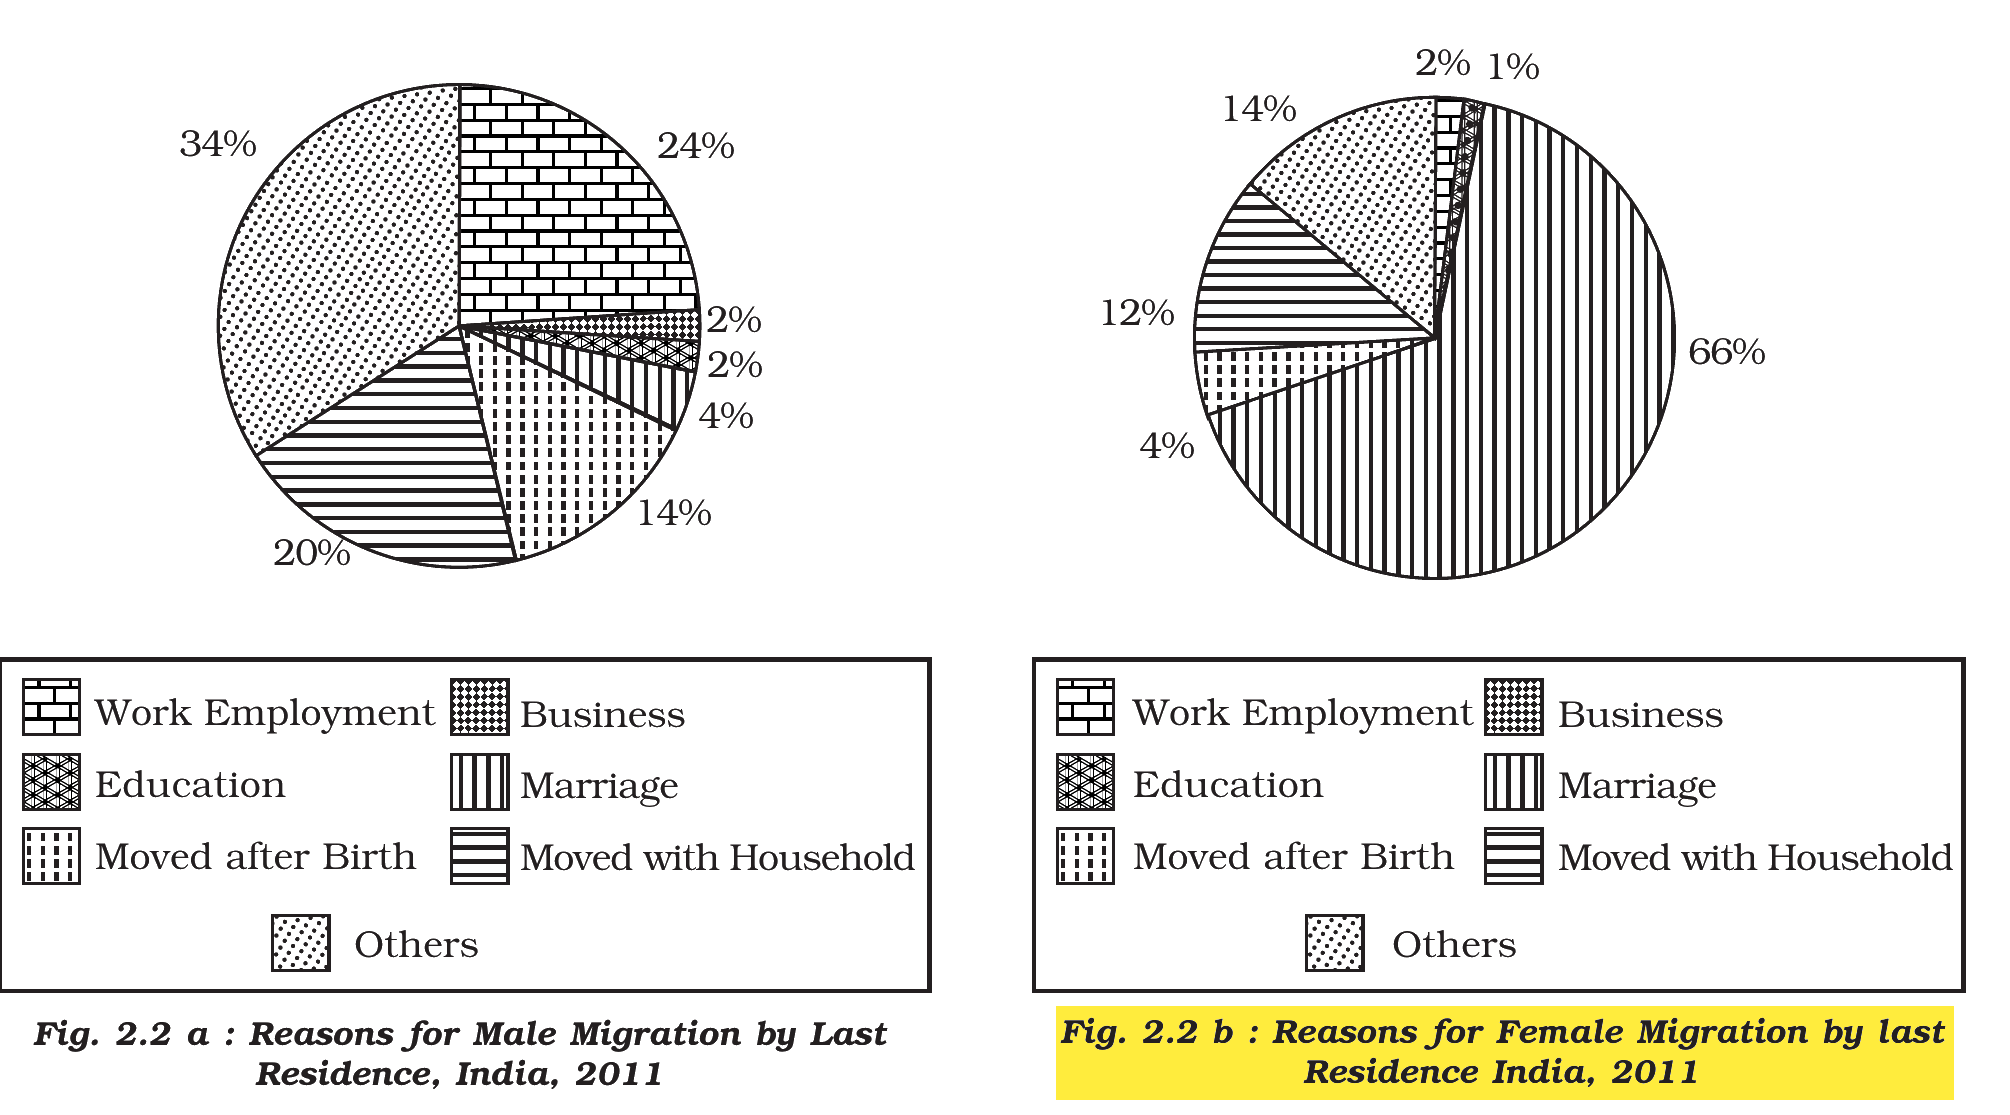
Study the given diagram and answer the following question.
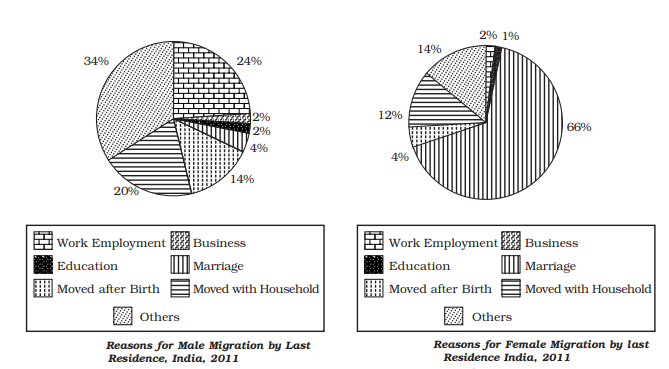
The percentage share for different reasons of female migration is calculated by dividing number of associated female migrants with __________.
Answer & explanation
Correct answer: option 3
The correct answer is Option (3) → Total female migrants of India
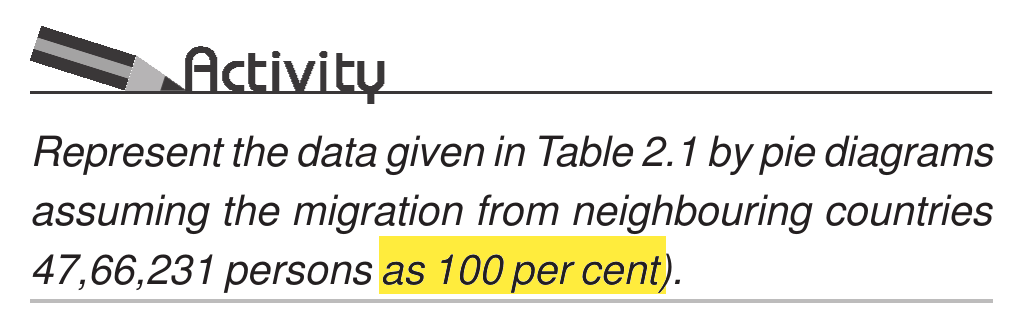
Each pie diagram stands for one whole group. The whole circle is 100 per cent, and each slice is the share of one reason in that group.
The female diagram shows the reasons for female migration. So its whole circle is all the female migrants. The share of a reason is worked out as: female migrants for that reason ÷ total female migrants of India × 100.
Option (1) Total population of India — Incorrect. This would also count men and all the people who never migrated.
Option (2) Total female population — Incorrect. This would also count the women who never migrated. The diagram covers only women who migrated.
Option (3) Total female migrants of India — Correct. The female diagram divides all female migrants by their reasons, so each share is taken out of this total.
Option (4) Total migrants of India — Incorrect. This would also count male migrants, who have a separate diagram of their own.
Note 1: This question is taken from the pre-rationalised NCERT book. The latest edition (2026-27) does not have this part. An extract of the pre-rationalised NCERT book is given below for the benefit of students.
Note 2: The given answer is as per the official NTA Answer Key. The book does not give this calculation in clear words. It shows the reasons for female migration as slices of one circle (Fig. 2.2 b), and its activity on pie diagrams takes the whole group of migrants as 100 per cent.
Pre-rationalised NCERT:
Fig. 2.2 a : Reasons for Male Migration by Last Residence, India, 2011; Fig. 2.2 b : Reasons for Female Migration by last Residence India, 2011
Box: Activity (Chapter 2: Migration: Types, Causes and Consequences) |