
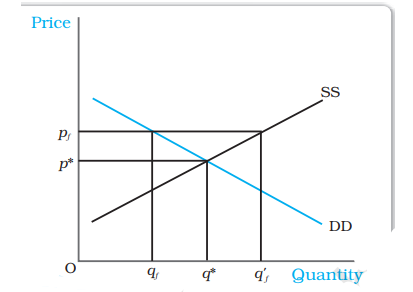
The diagram shows excess supply at price _______ and equilibrium at price _______.
Answer & explanation
Correct answer: option 2
The correct answer is Option (2) → pf, p*
Demand and supply meet at p*, so p* is the equilibrium price. At the higher price pf, firms supply q′f but buyers want only qf, so there is excess supply.
NCERT (2026-27): “5.2.2 Price Floor … Figure 5.8 shows the market supply and the market demand curve for a commodity on which price floor is imposed. The market equilibrium here would occur at price p* and quantity q*. But when the government imposes a floor higher than the equilibrium price at pf , the market demand is qf whereas the firms want to supply q′f, thereby leading to an excess supply in the market equal to qf q′f . In the case of agricultural support, to prevent price from falling because of excess supply, government needs to buy the surplus at the predetermined price.” |