
Column - I gives a list of possible set of parameter measures in some experiments. The variations of the parameters in the form of graphs are shown in Column - II. Match the set of parameters given in Column - I with the graphs given in Column - II.
|
Column I |
Column II |
|
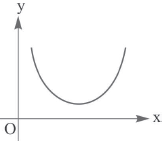
A. Potential energy of a simple pendulum (y-axis) as a function of displacement (x-axis). |
(p) |
|
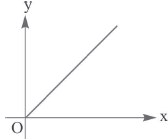
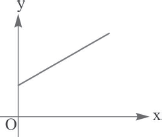
B. Displacement (y-axis) as a function of time (x-axis) for one dimensional motion at zero or constant acceleration when the body is moving along the positive x-direction. |
(q) |
|
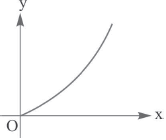
C. Range of a projectile (y-axis) as a function of its velocity (x-axis) when projected at a fixed angle. |
(r) |
|
D. The square of the time period (y-axis) of a simple pendulum as a function of its length (x-axis) |
(s) |
Answer & explanation
Correct answer: option 1
The correct answer is Option (1) → A→p,s;B→q,s;C→s;D→q
A: The graph of potential energy as function of displacement of a simple pendulum will be parabolic graph as given in option (p). The option (s) is also correct, if the mean position of the pendulum is at the origin.
Hence (A) → (p),(s)
B: The body is moving along positive x-axis, v>0; y is the displacement.
$∴y=ut±\frac{1}{2}at^2$. For a=+ve and a=0, we get graphs which are satisfied by (q) and (s).
Hence (B)→(q),(s)
C: $R=\frac{u^2\sin(2θ)}{g}$ and $R∝u^2$ for a fixed angle of projection and $u=0,R=0$
(C)→(s)
D: Time period of a simple pendulum is:
$T=2π\sqrt{\frac{l}{g}}$ or $T^2=4π^2\frac{l}{g}⇒y=\frac{4π^2}{g}x$
(D)→(q)