CUET Preparation Today
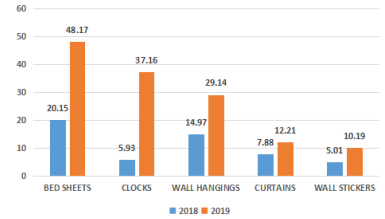
A home decor company produces five different products - Bed sheets, Clocks, Wall hangings, Curtains and Wall stickers. The sales of these five products (in lakh number of packs) during 2018 and 2019 are shown in the following bar-graph.
Based on the given information, sales have increased by nearly 55% from 2018 to 2019 in the case of: |
Curtains Bed sheets Wall stickers Wall hangings |
Curtains |
Lets solve one by one for each option. 1. Curtains Increase in sale from 2018 to 2019 = \(\frac{12.21 - 7.88 }{7.88 }\) × 100 = \(\frac{ 4.33 }{7.88 }\) × 100 = 54.94% = 55% ( approx ) 2. Bed sheets Increase in sale from 2018 to 2019 = \(\frac{48.17 - 20.15 }{20.15 }\) × 100 = \(\frac{ 28.02 }{20.15 }\) × 100 = 13.9% 3. Wall stickers Increase in sale from 2018 to 2019 = \(\frac{10.19 - 5.01 }{5.01 }\) × 100 = \(\frac{ 5.18 }{5.01 }\) × 100 = 103.39% 4. Wall hangings Increase in sale from 2018 to 2019 = \(\frac{29.14 - 14.97 }{14.97 }\) × 100 = \(\frac{14.17 }{14.97 }\) × 100 = 94.65% Ans :- Curtains
|