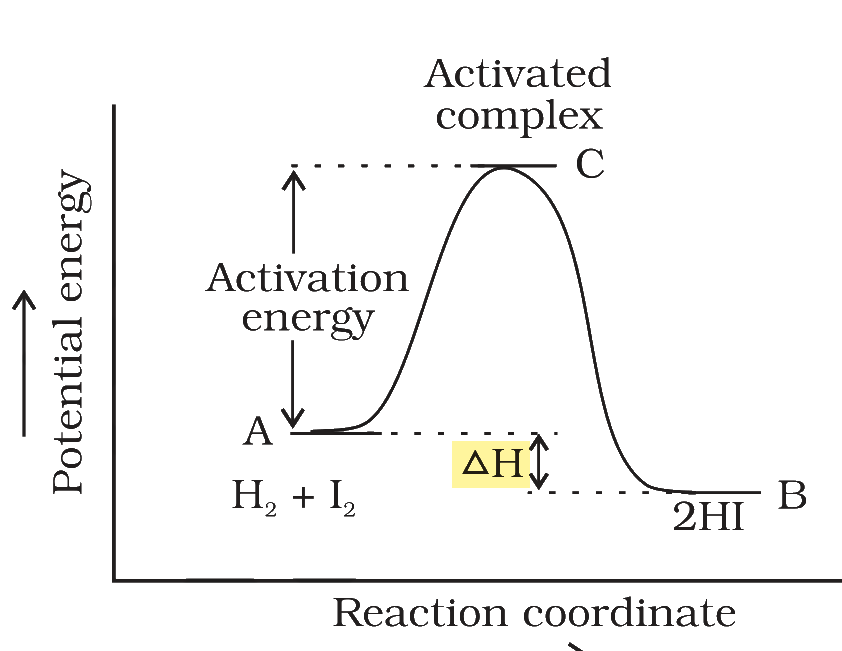
According to the following graph, the given reaction is a
Answer & explanation
Correct answer: option 2
The correct answer is Option (2) → Exothermic Reaction
A potential energy diagram follows the energy of the system as reactants turn into products:
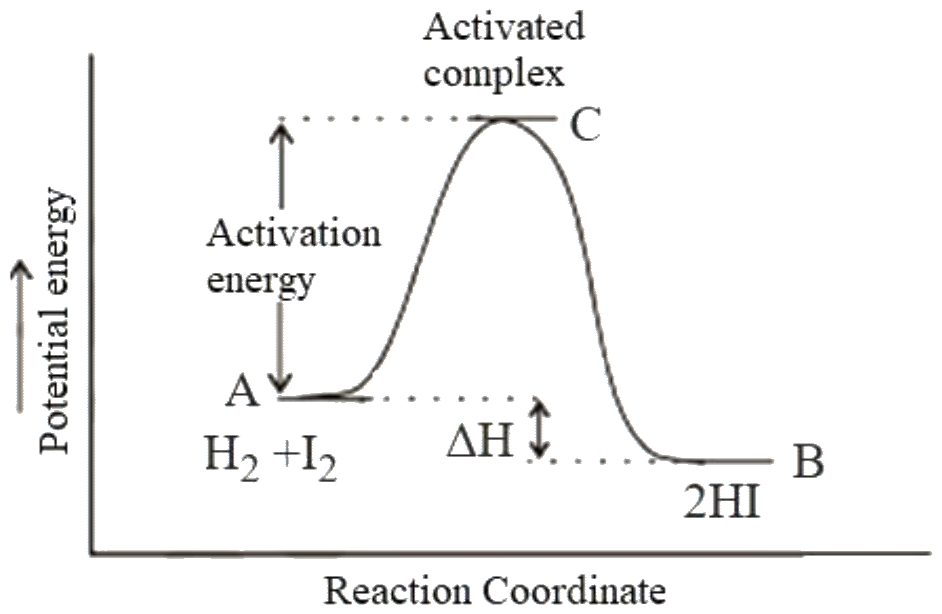
The peak is the activated complex; the climb from the reactants to it is the activation energy (Ea).
The difference between the product and reactant levels is the enthalpy change:
\( \displaystyle \Delta H=H_{\text{products}}-H_{\text{reactants}} \)
If the products lie below the reactants, ΔH is negative and heat is released: exothermic. If they lie above, ΔH is positive: endothermic.
In the graph, the reactants \( \ce{H2} \) + \( \ce{I2} \) are at level A, and the product 2HI is at level B, which is lower than A by ΔH. So ΔH < 0 and the reaction is exothermic.
Why the other options are incorrect
Option (1) Endothermic Reaction — Incorrect. For an endothermic reaction the product level B would lie above the reactant level A.
Option (3) Decay Reaction — Incorrect. A decay is a nuclear process of a single unstable nucleus; \( \ce{H2} \) + \( \ce{I2} \) → 2HI is a chemical reaction between two molecules.
Option (4) Pseudo-first Order Reaction — Incorrect. The order of a reaction is found from the rate law by experiment; it cannot be read from an energy diagram.
NCERT (2026-27 edition):
Temperature Dependence of the Rate of a Reaction – “… It can be understood clearly using the following simple reaction H2(g) + I2(g) → 2HI(g) … Fig. 3.7 is obtained by plotting potential energy vs reaction coordinate. … Some energy is released when the complex decomposes to form products. So, the final enthalpy of the reaction depends upon the nature of reactants and products.”