CUET Preparation Today
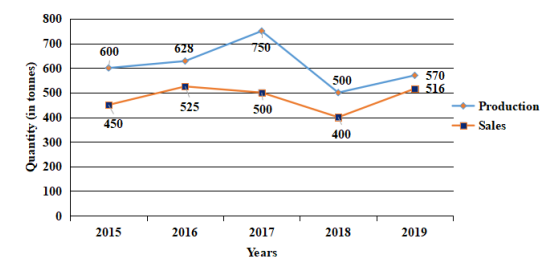
The given line graph shows the production (in tonnes) and the sales (in tonnes) of a company.
What is the difference (in tonnes) in the production in 2015 and 2017 taken together and the sales in 2018 and 2019 taken together? |
309 334 434 462 |
434 |
Production of company in 2015 and 2017 = 600 + 750 = 1350 Sale of company in 2018 and 2019 = 400 + 516 = 916 Difference in production in 2015 and 2017 & sale in 2018 and 2019 = 1350 - 916 = 434 |