CUET Preparation Today
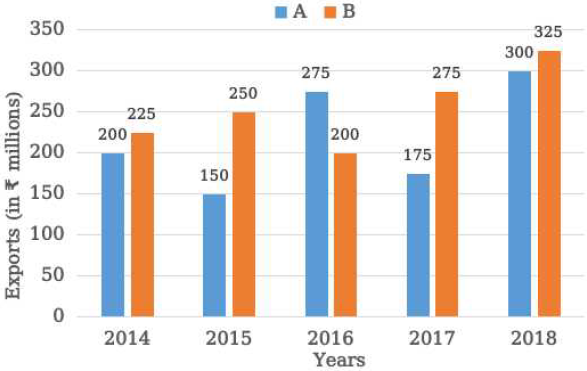
The bar graph shows the exports of cars of type A and B (in ₹ millions) from 2014 to 2018.
The total exports of cars of type A from 2014 to 2016 is approximately what percentage less than the total exports of cars of type B from 2015 to 2017 (correct to one decimal place)? |
10.4% 11.7% 11.3% 13.8% |
13.8% |
Total exports of cars of type A from 2014 to 2016 = 200 + 150 + 275 = 625 Total exports of cars of type B from 2015 to 2017= 250 + 200 + 275 = 725 Required percentage = \(\frac{725 - 625}{725}\) × 100 = \(\frac{100}{725}\) × 100 = 13.8% |